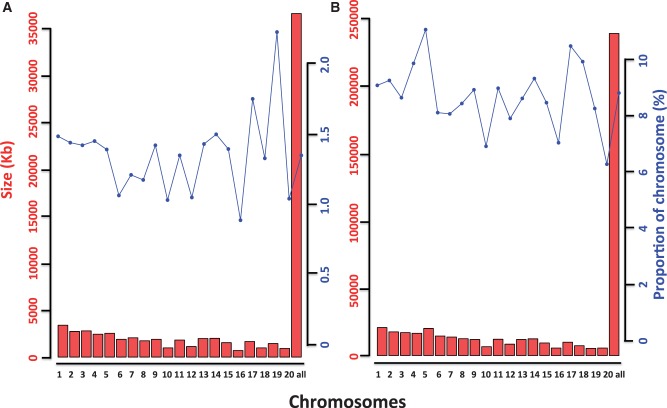
Fig. 4.
Distribution of PIRs in the TM genome. The red bar represents the total sizes of PIRs in each chromosome, and the blue plot represents the proportion of the PIRs in each chromosome (based on the full size of the reference genome). The last column “all” means the sum of the 20 autosomes. (A) With the P value = 0.01 as cutoff. (B) With the P value = 0.05 as cutoff.

