Fig. 3.
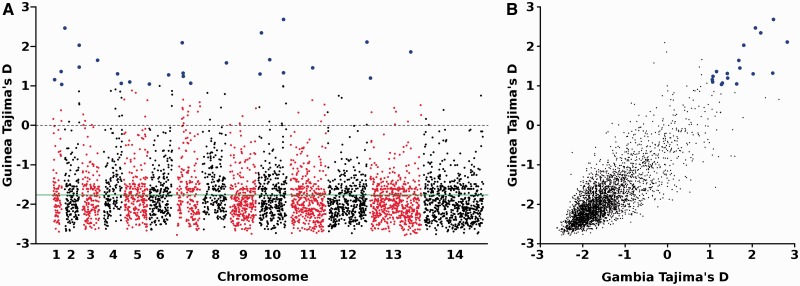
Genome-wide distribution of Tajima’s D values summarizing the allele frequency spectra for P. falciparum genes with three or more SNPs. (A) Tajima’s D values for each of 4,012 P. falciparum genes with three or more SNPs in Guinea (N’Zerekore population sample of 100 isolate sequences). Individual chromosomes are identified by the alternate black and red coloring, with genes plotted as individual points based on their position within each chromosome. Genes with Tajima's D values > 1 are highlighted with enlarged blue symbols. Detailed data for each of the genes are given in supplementary table S3, Supplementary Material online. (B) Correlation between Tajima’s D scores for the Guinea (N’Zerekore) population and a previously sampled population from The Gambia (Greater Banjul area), analyzing 3,316 genes that had three or more SNPs in each of the populations. Genes with a Tajima’s D value of > 1 in both populations are highlighted with enlarged blue symbols (and identified in table 1).

