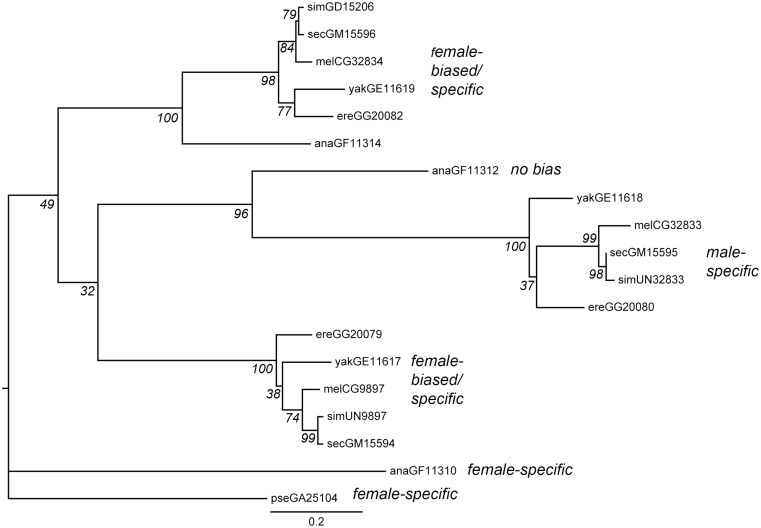
Fig. 4.
Maximum-likelihood phylogeny of protein sequences for each member of the gene family. Bootstrap support based on 100 replicates is shown in italics at each node. Tip labels indicate protein names; the first three letters indicate the Drosophila species (mel: melanogaster; sim: simulans; sec: sechellia; yak: yakuba; ere: erecta; ana: ananassae; pse: pseudoobscura), and the following characters indicate the FlyBase gene name. “UN” in the gene name indicates a previously unannotated copy of the gene in D. simulans. Scale bar indicates the number of substitutions per site. Calls of orthology are consistent with phylogenetic clustering and gene order (see fig. 1): the six genes shown at the top of the figure (GD15206–GF11314) are one set of orthologs, GF11312–GG20080 are another set, and GG20079–GF11310 are the third set. The tree is rooted on the single D. pseudoobscura copy of this gene family, GA25104. Gene expression patterns from figure 2 are indicated in italicized text.

