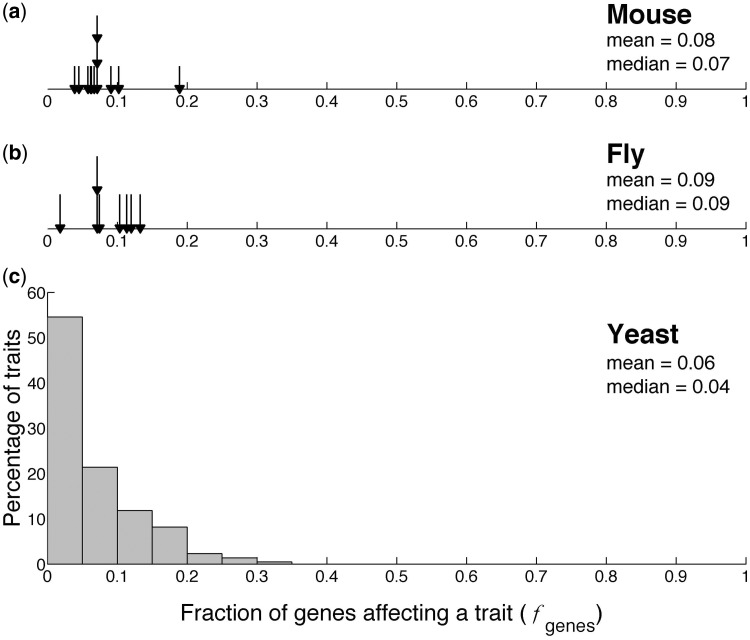
Fig. 1.
Fraction of genes affecting a trait, with the mean and median values indicated. (a) Patterns emerging from 12 traits examined in 250 lines of knockout mice. (b) Patterns emerging from eight traits examined in various P-element insertion lines of fruit flies. In (a) and (b), each arrow represents one trait. (c) Frequency distribution of the fraction of genes affecting a trait, derived from 220 morphological traits examined in 4,718 nonessential gene deletion lines of yeast.

