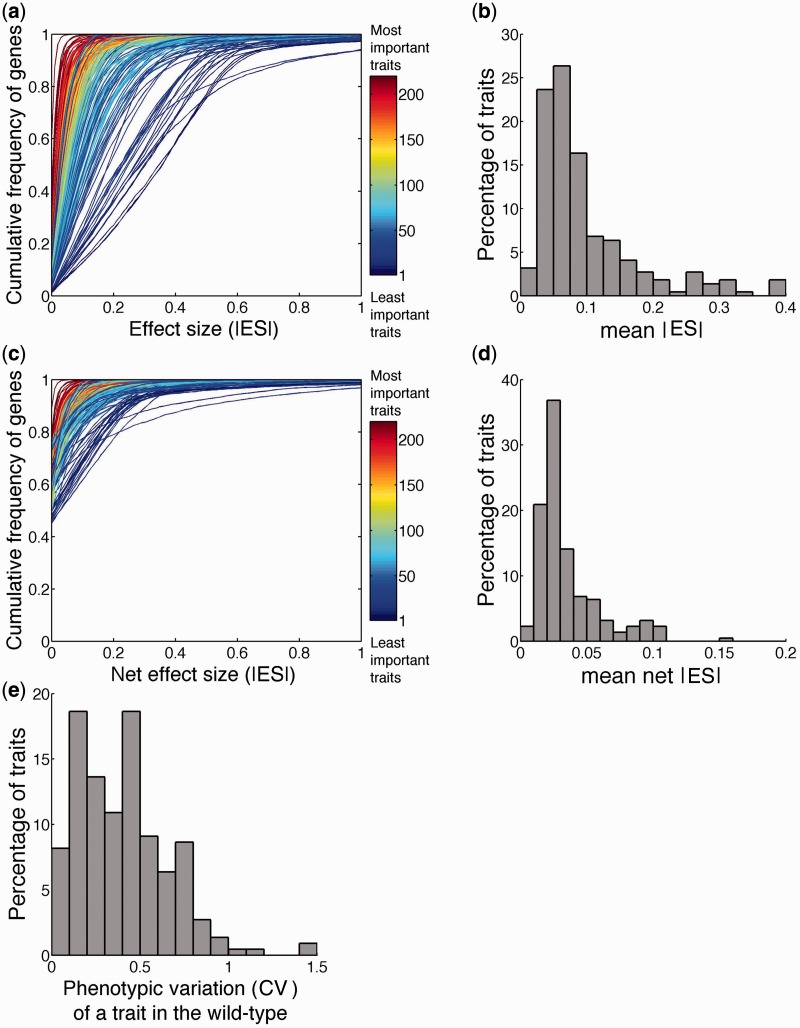
Fig. 2.
Distributions of the absolute values of the raw and net effect sizes (|ES|) of 4,718 nonessential gene deletions on 220 morphological traits in yeast. (a) Cumulative probability distributions of raw |ES| of 4,718 gene deletions on 220 traits. Each curve represents a trait and is colored according to trait importance (TI). The distributions are shown only in the range of 0 < |ES| < 1 to better distinguish among different curves. (b) Distribution of the mean raw |ES| among the 220 traits. (c) Cumulative probability distributions of net |ES| of 4,718 gene deletions on 220 traits. (d) Distribution of the mean net |ES| among the 220 traits. (e) Distribution of the wild-type phenotypic variation (CV) among the 220 traits.

