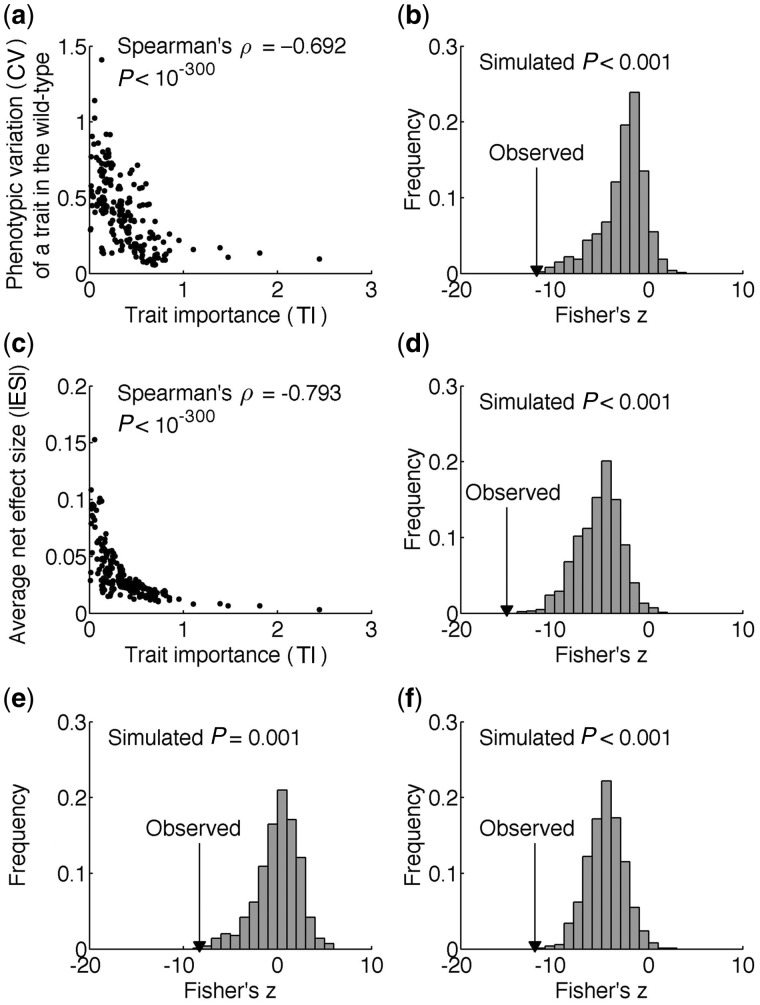
Fig. 3.
Environmental/stochastic robustness and genetic robustness of yeast morphological traits. (a) The CV of a trait among isogenic wild-type cells decreases with the rise of TI. Each dot is a trait. (b) Distribution of Fisher’s z derived from the rank correlation between CV and pseudo TI. (c) The mean net |ES| of gene deletion on a trait decreases with the rise of TI, demonstrating genetic robustness. Each dot is a trait. (d) Distribution of Fisher’s z derived from the rank correlation between mean net |ES| and pseudo TI. (e) Distribution of Fisher’s z derived from the partial rank correlation between CV and pseudo TI, after the control of mean net |ES|. (f) Distribution of Fisher’s z derived from the partial rank correlation between mean net |ES| and pseudo TI, after the control of CV. In (b), (d), (e), and (f), the real z observed from the actual data is indicated by an arrowhead, and the P value is the probability that a randomly picked pseudo z is more negative than the real z.

