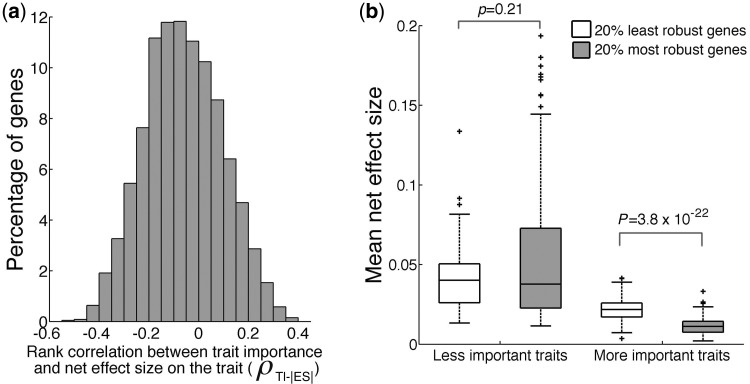
Fig. 4.
Among-gene variation in contribution to genetic robustness. (a) Frequency distribution of a gene’s rank correlation (ρ) between its absolute net effect size (|ES|) on a trait and the TI. Most genes show negative correlations. (b) Effect size differences between the 20% most robust (having the most negative ρ values in a) and 20% least robust (having the smallest |ρ| values) genes on traits of different importance. Traits are divided into two equal-size bins based on TI: less-important traits and more important traits. In the box plot (see the scale marked on the y-axis), the lower edge and upper edge of a box represent the 25% quartile (q1) and 75% quartile (q3), respectively. The horizontal line inside a box indicates the median (md). The whiskers extend to the most extreme values inside inner fences, md ± 1.5(q3 − q1). The values outside the inner fences (outliers) are plotted by plus signs.

