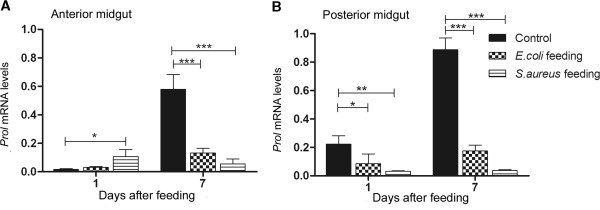
Figure 6.

Relative transcript abundance of prolixicin encoding mRNA in Rhodnius prolixus midgut wall after bacterial feeding. Anterior and posterior midgut samples collected 1 and 7 days after feeding. A: anterior midgut relative mRNA levels. B: posterior midgut relative mRNA levels. Treatments: black column - insects fed with blood alone (control); grid column - insects fed with blood plus E. coli; striped column - insects fed with blood plus S. aureus. Error bars represent SD of three independent experiments. Asterisks relate to significant differences (*p < 0.05, **p < 0.01, ***p < 0.001) obtained after data analyses using one way ANOVA and unpaired t tests.
