
Figure 9.
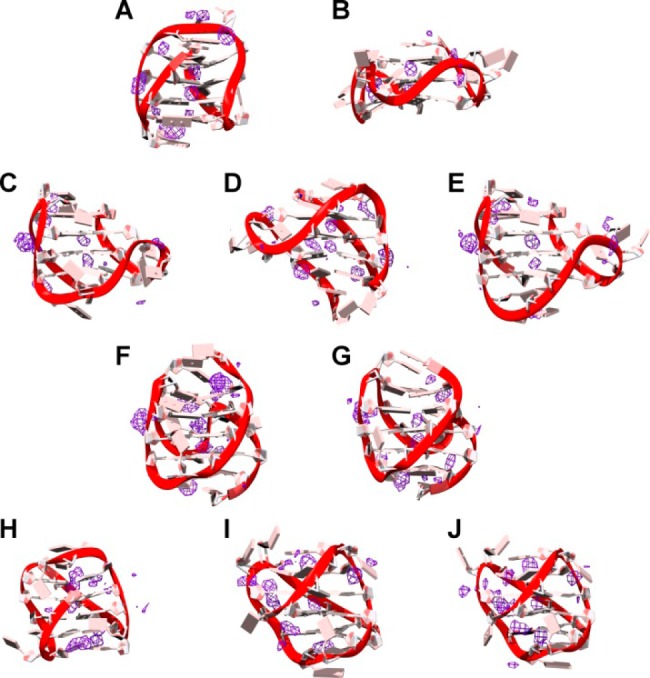
Pseudodensity grid maps of cations for 143D (A), 1KF1 (B), 2GKU (C), 2HY9 (D), 2JSM (E), 2JPZ (F), 2JSL (G), 2KF8 (H), 2KKA-G (I), and 2KKA-I (J). Cation density (purple) was contoured at 3× the density of sodium (6 M) for 143D and at 3× the density of potassium (4 M) for the other G-quadruplex structures. The average structure of each G-quadruplex over the trajectory is shown.