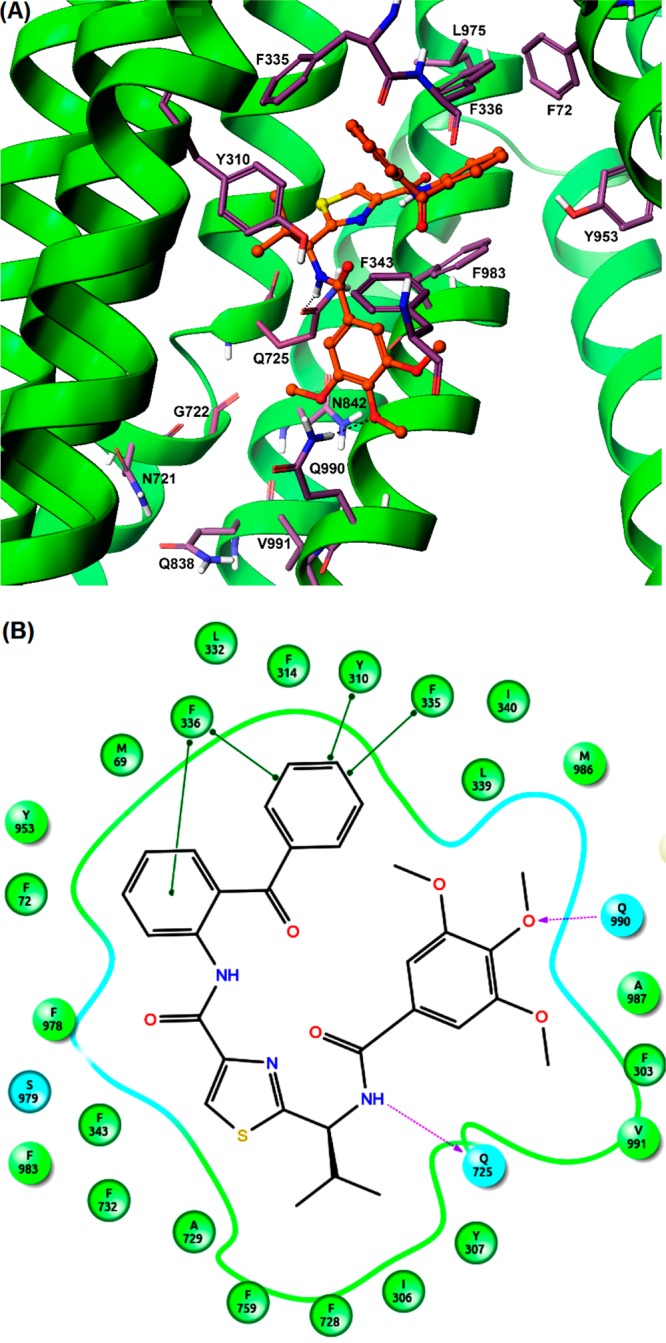
Figure 5.

Induced-fit docking model of compound 28 at site-1 of human P-gp homology model. (A) A portion of the transmembrane region of homology modeled human P-gp is shown in ribbon presentation. Selected amino acids are depicted as sticks with the atoms colored as carbon, purple–blue; hydrogen, white; nitrogen, blue; oxygen, red; sulfur, yellow), whereas the inhibitor is shown as a ball and stick model with the same color scheme as above except carbon atoms are represented in orange. Hydrogen bonds are shown as black dashes. The ribbon representation for portions of TM3 and TM6 was undisplayed for better view. (B) A two-dimensional ligand–receptor interaction diagram with important interactions observed in the docked complex of compound 28 with the drug-binding site residues of human P-gp is shown. The amino acids within 5 Å are shown as colored bubbles, cyan indicates polar, and green indicates hydrophobic residues. Hydrogen bonds are shown by purple dotted arrows, while π-stacking aromatic interactions are shown by green lines.
