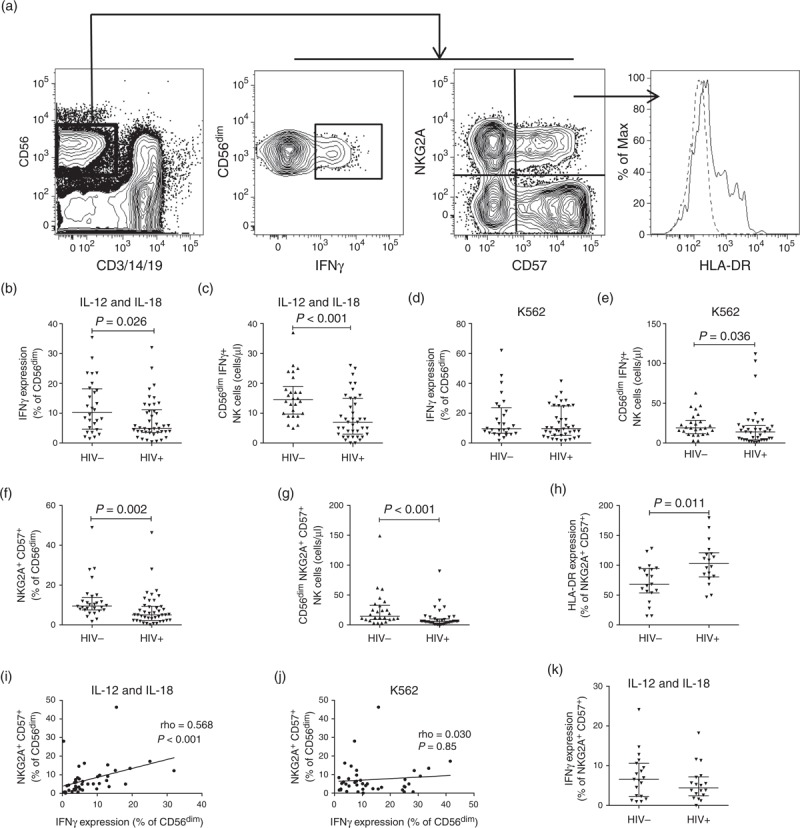
Fig. 1.
Characteristics of natural killer cells in HIV-1 subtype D infection.

Contour plots, with outliers, illustrating the gating strategy used to identify CD56dim NK cells expressing IFNγ, NKG2A, CD57 and HLA-DR (a). The dashed histogram is the FMO and the continuous line shows HLA-DR expression. Scatter dot plots comparing the median frequencies and interquartile ranges of CD56dim NK cells expressing IFNγ in HIV-infection when stimulated with IL-12 and IL-18, expressed as a percentage (b) or an absolute count (c). Percentage (d) and absolute count (e) responses after stimulation with K562. Levels of NKG2A+CD57+ cells as a percentage (f) and absolute count (g). Activation levels in NKG2A+CD57+ CD56dim NK cells (h). Frequency of the NKG2A+CD57+ CD56dim subset correlated with the frequency of CD56dim NK cells expressing IFNγ when stimulated with IL-12 and IL-18 (i), or K562 (j). IFNγ expression in NKG2A+CD57+CD56dim NK cells after IL-12 and IL-18 stimulation (k).
