Figure 6.
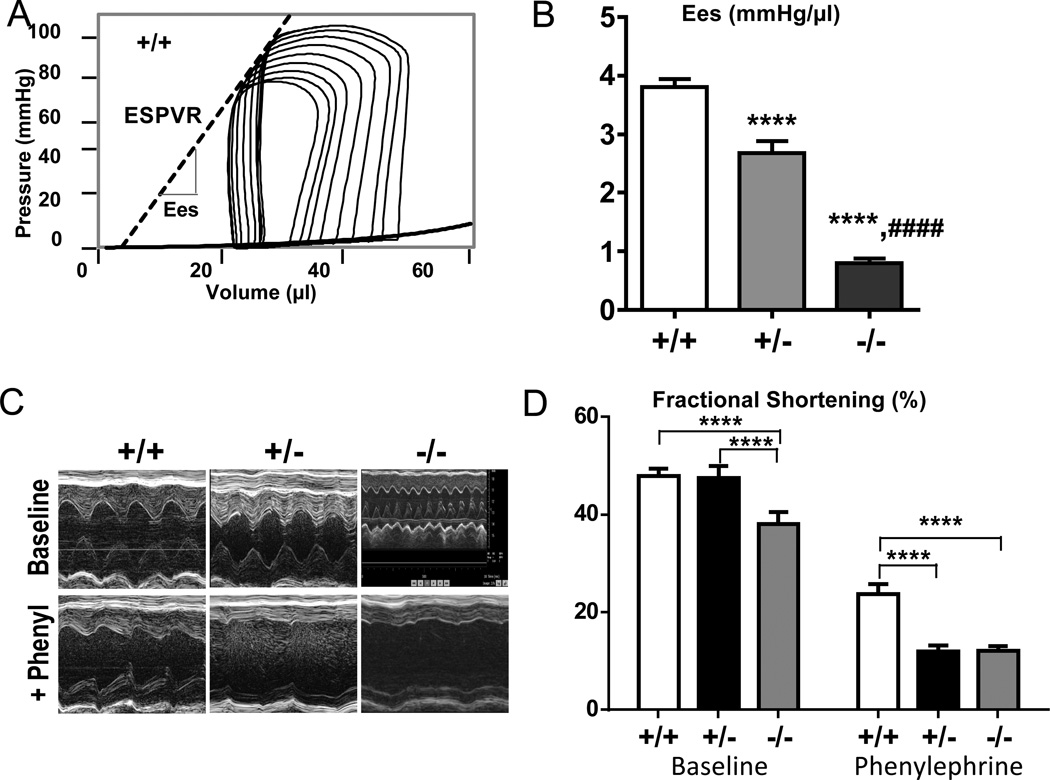
In vivo characterization of LV systolic function. A) Representative example of an IVC occlusion PV loop series; End-systolic elastance (Ees) (broken line) is depicted and (B) quantitative data show a significant decrease in Ees in Rbm20ΔRRM mice. C) Representative +/+, +/−, and −/− echocardiographic M-mode images and (D) quantitative analysis of the phenylephrine stress test performed in conscious mice, indicating a decrease in systolic reserve in Rbm20ΔRRM mice. Symbols: ****p<0.0001 vs. wild-type (+/+); ####p<0.0001 vs. Het (+/−). A–B: 12 +/+ mice, 12 +/− mice and 13 −/− mice; C–D: 13 +/+ mice, 12 +/− mice and 12 −/− mice.

