
Figure 1. Analysis of Array Gene Expression.
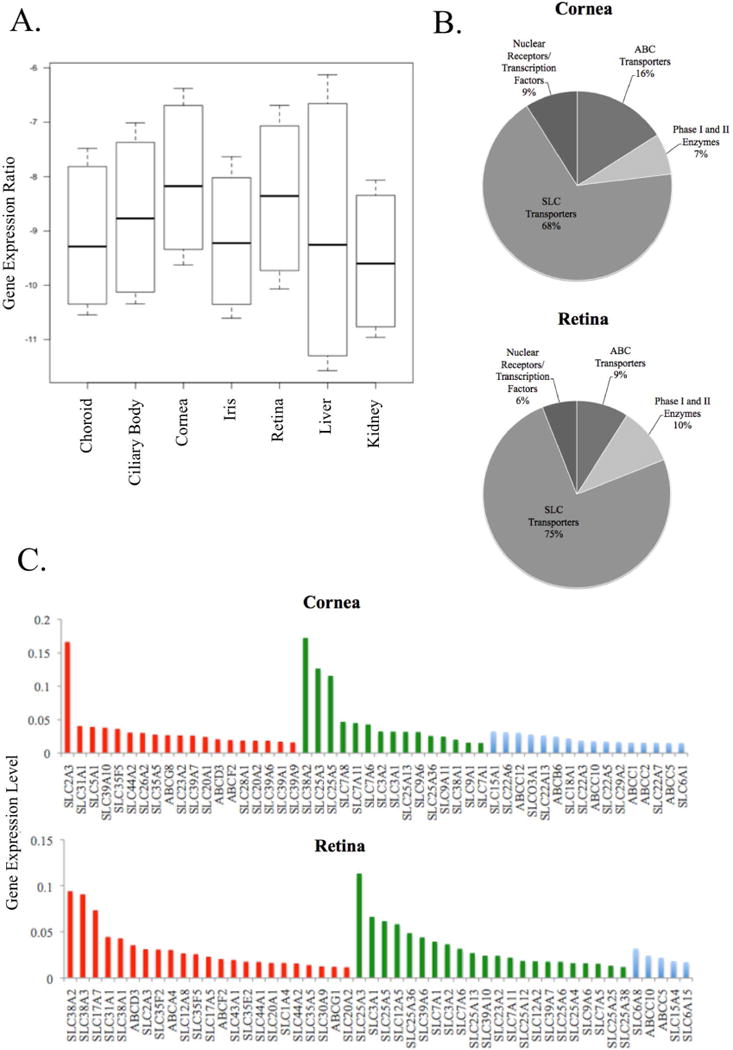
The distribution of mRNA expression values (log-transformed ΔCt values) for all genes in all eye regions (n=15) in addition to the liver (n=60) and kidney (n=60) is shown in the boxplot (A). Ocular data are from six orbs obtained from three individuals, see Supplemental Table S1 for donor information. The boxes depict the 25th and 75th percentile (the lower and upper quartiles, respectively), the middle band is the 50th percentile (median) and the upper and lower whiskers represent the data minimum and maximum, respectively. (B) The pie graphs show the distribution of functional annotation categories (SLC transporters, ABC transporters, Phase I and Phase II enzymes, nuclear receptors and transcription factors) of the top-100 most highly expressed genes in the cornea (top graph) and retina (bottom graph). (C) Bar graphs of the top 50 most highly expressed transporter genes, separated into three functional classes, are shown for the cornea (top plot) and retina (bottom plot). On the y-axis, ΔCt levels for each gene are shown, while the colored bars on the x-axis correspond to annotated functional class: nutrient transporters (red), xenobiotic transporters (blue) and other molecular or functional role (green).