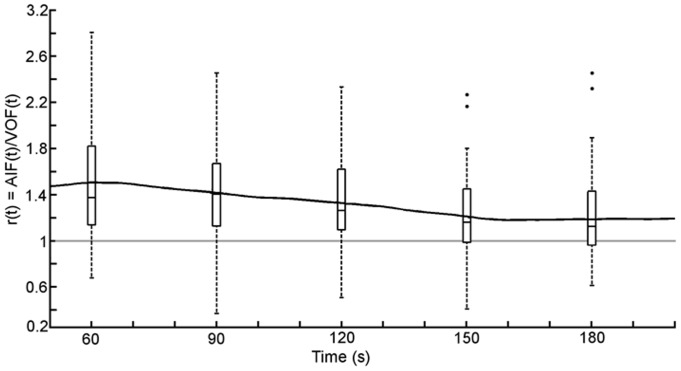
Figure 4. The ratio of the ICA to the SSS over the duration of the extended scan.
Each point on the black line is an average of 52 time-ratios. At 30 second intervals a box plot (Solid line is the median value at that time point) representing all 52 patients illustrates the spread of the data across all patients at that point in time.

