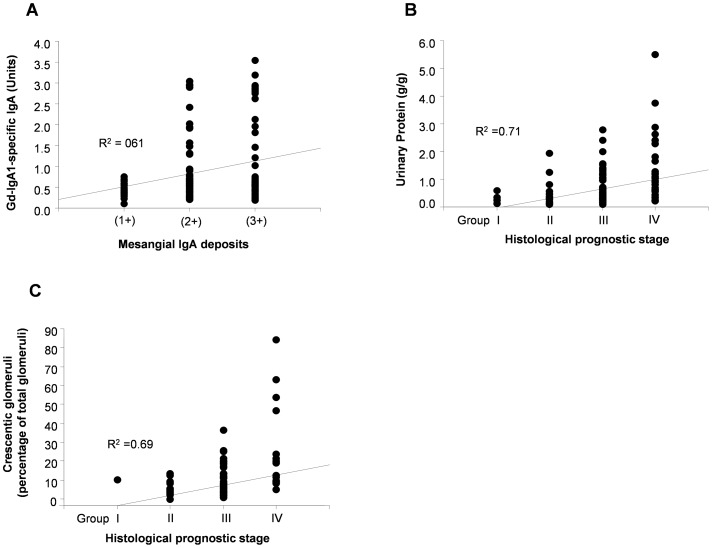
Figure 3. Correlation between biomarkers, histological findings and clinical findings.
The strength of correlation between biomarkers, histological findings and clinical findings was measured by the Spearman's correlation coefficient. The serum level of Gd-IgA1-specific IgA correlated with the amount of mesangial IgA deposits (A). Histological prognostic stage (Clinical Guidelines for IgA Nephropathy in Japan, second version) [17] correlated with the urinary protein/creatinine ratio (B), and percentage of glomeruli with a crescent (C).

