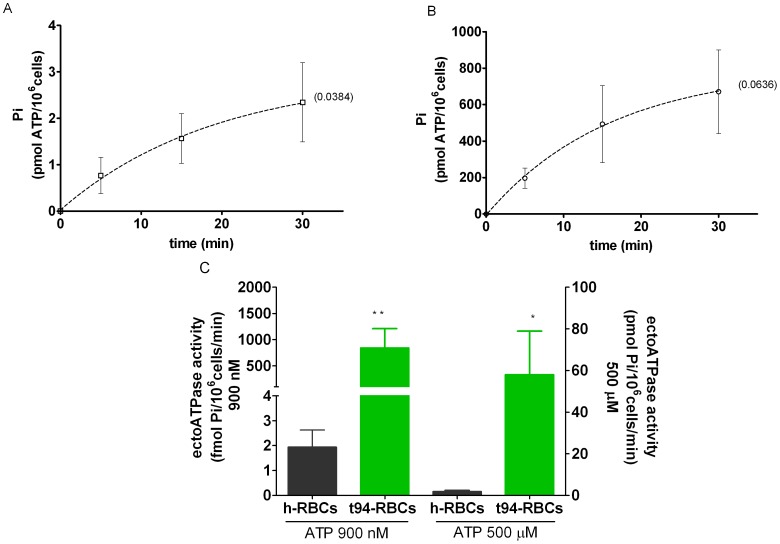
Figure 6. Apparent maximal ectoATPase activities of h-RBCs and t94-RBCs.
A, B. Rates of Pi accumulation ([32P]Pi) released from exogenous 500 µM [γ-32P]ATP, using suspensions of noninfected RBCs (h-RBCs, N = 4, n = 4) and trophozoite-infected RBCs at 94% parasitemia (t94-RBCs; N = 3, n = 4). The dotted lines represent the fitting of exponential functions to experimental data, with values of the corresponding rate constant (k) given in brackets. Values of best fit were used to calculate apparent maximal ectoATPase activities as described in Materials and Methods. C. Apparent maximal ectoATPase activities at 500 µM ATP were determined from exponential fits of A and B. For a comparison, ectoATPase activities of h- and t94-RBCs at 900 nM ATP, taken from Fig. 5, are shown. Significant differences are indicated (*, p<0,05, **, p<0,01). Results are means ± SEM.

