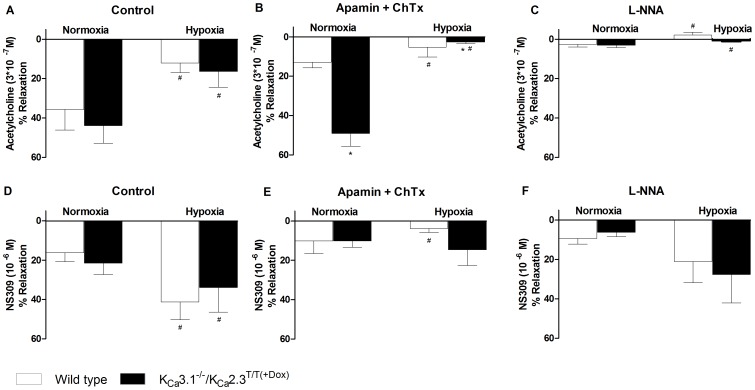
Figure 5. Functional studies of acetylcholine-induced (3*10−7 M) relaxation (A–C) and NS309-induced (10−6 M) relaxation (D–F) in wild type and KCa3.1−/−/KCa2.3T/T(+Dox) mice.
A) Acetylcholine-induced relaxation. B) Acetylcholine-evoked relaxation in the presence of apamin (5*10−7 M) and ChTx (10−7 M). C) Acetylcholine-evoked relaxation in the presence of L-NNA (10-4 M). D) NS309-induced relaxation. E) NS309-induced relaxation in the presence of apamin (5*10−7 M) and ChTx (10−7 M). F) NS309-evoked relaxation in the presence of L-NNA (10−4 M). Data were analyzed by 2-way ANOVA and * P<0.05 vs. wild type and # P<0.05 vs. normoxia; n = 6-7 per group.

