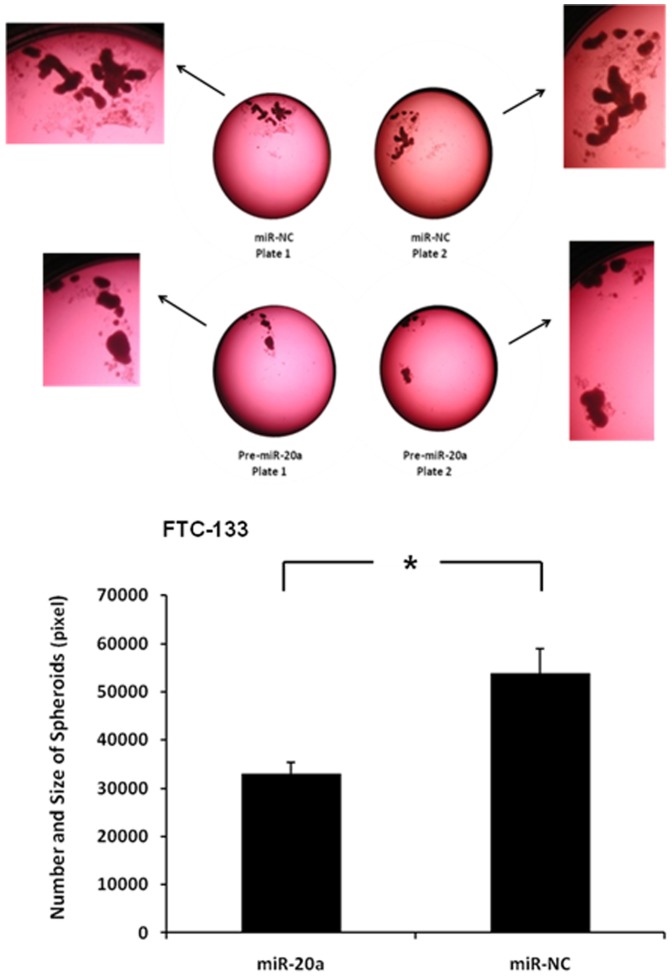
Figure 3. MiR-20a overexpression decreases tumor spheroids.
(A) Representative image of spheroids in culture with miR-20a overexpression. (B) Quantification of spheroid difference with miR-20a overexpression. The total area occupied by the spheroids within an image was measured by circumscribing the perimeter of each spheroid, marking the entire area, and calculating the pixel numbers with ImageJ software (Maryland, USA). The Y axis represents the size and number of the spheroids. Error bars represent SEM (* indicates p<0.05).

