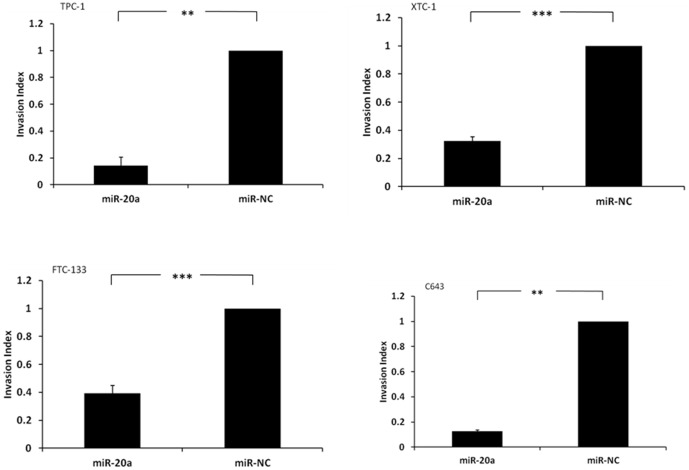
Figure 4. MiR-20a overexpression inhibits thyroid cancer cell invasion.
(A) TPC-1 thyroid cancer cell line, (B) XTC-1 thyroid cancer cell line, (C) FTC-133 thyroid cancer cell line, and (D) C643 thyroid cancer cell line. The Y axis represents the invasion index of the thyroid cancer cells. Error bars represent standard error of mean (* indicates p<0.05; ** indicates p<0.01; *** indicates p<0.001).

