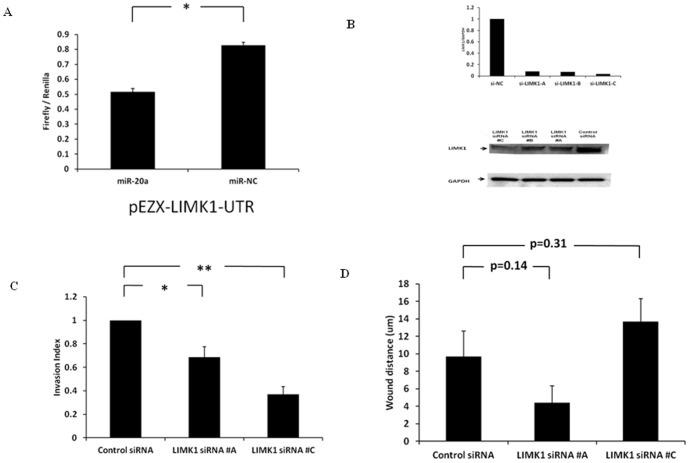
Figure 6. MiR-20a targets LIMK1 and LIMK1 regulates cellular invasion.
(A) Luciferase activity of pEZX-LIMK1-UTR in FTC-133 cells when co-transfected with miR-20a or miR-NC. All luciferase measurements were made in triplicates and readings were performed at 24 hours post-transfection. Error bars represent standard error of mean (* indicates p<0.05). (B) LIMK1 siRNA knockdown in FTC-133 thyroid cancer cell line. LIMK1 mRNA expression by quantitative RT-PCR (top panel). LIMK1 protein expression by Western blot (bottom panel). Data shown is for 72 hours after siRNA transfection. (C) Cellular invasion with LIMK1 knockdown. Transfection of LIMK1 siRNAs inhibited FTC-133 thyroid cancer cells invasion. The Y axis represents the invasion index of the thyroid cancer cells. Data shown is for 72 hours after siRNA transfection. Error bars represent standard error of mean (* indicates p<0.05; ** indicates p<0.01). (D) Transfection of LIMK1 siRNAs has no effect on the migration of FTC-133 thyroid cancer cells. The Y axis represents the wound distance. Data shown is for 72 hours after siRNA transfection. Error bars represent standard error of mean.

