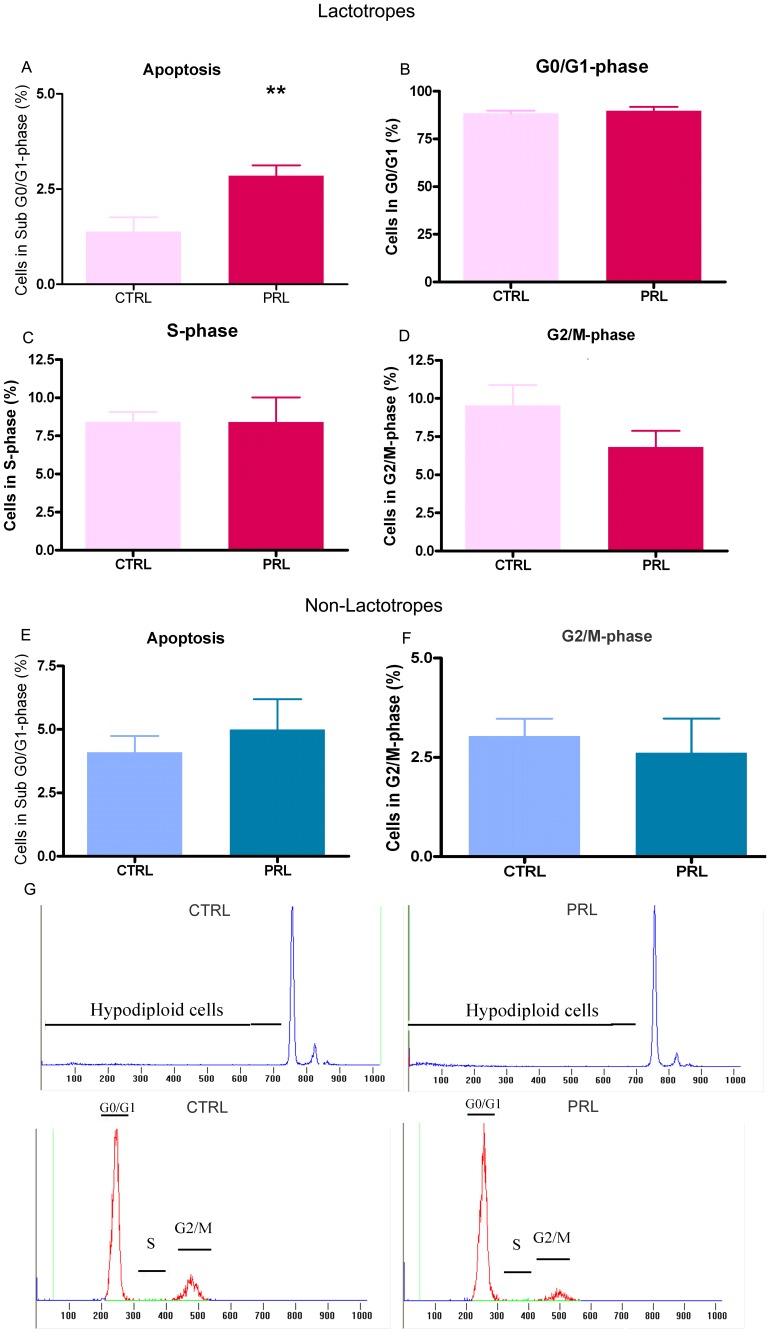
Figure 3. PRL increases lactotrope apoptosis in vivo.
Lactotropes were identified by PRL immunostaining and analyzed by FACS. Apoptosis and cell cycle analysis were performed in the PRL-positive subpopulation. A: Apoptosis was determined by FACS using PI. Each column represents the mean ± SEM of the percentage of sub cells in G0–G1. *p<0.05 vs. CTRL animals injected with vehicle, Student's t test. B–D: Cell cycle was analyzed by FACS using PI. Each column represents the mean ± SEM of the percentage of cells in G0/G1-phase (B), cells in S-phase (C) and cells in G2/M-phase (D) p = 0.05 for G2/M in oPRL respect to CTRL, Student's t test. E–F: oPRL treatment did not change the apoptosis rate (E) or the percentage of cells in G2/M in the PRL-negative subpopulation. G: Representative histograms showing hypodiploidy or cells in each stage of the cell cycle in CTRL and PRL-treated animals.

