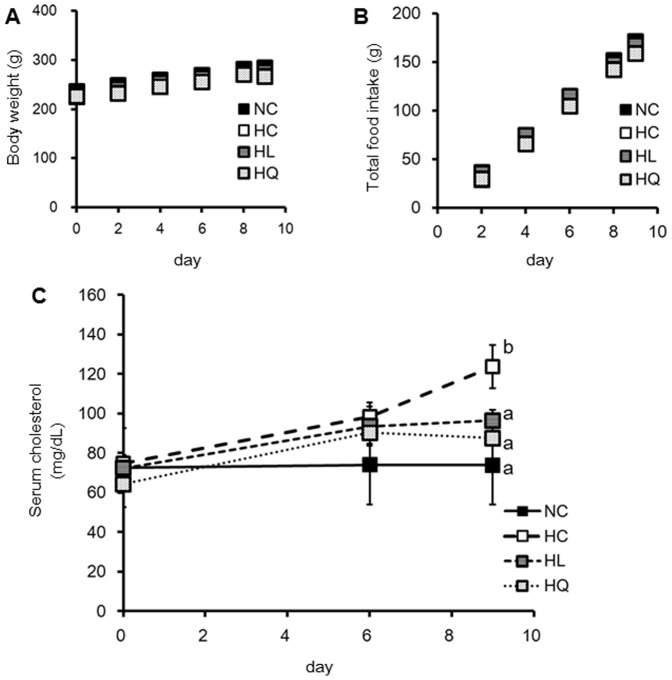
Figure 6. Body weight (A), total food intake (B), and serum concentration of cholesterol (C).
Values are mean ± standard error (n = 7 or 8). HC, high cholesterol diet (n = 7); HL, HC with 20 mM luteolin at 5 mL/kg body weight diet (n = 8); HQ, HC with 20 mM quercetin at 5 mL/kg body weight diet (n = 7); NC, noncholesterol diet (n = 7). Statistical analyses were performed using Tukey–Kramer multiple comparison test. Different letters indicate significant differences; P<0.05.

