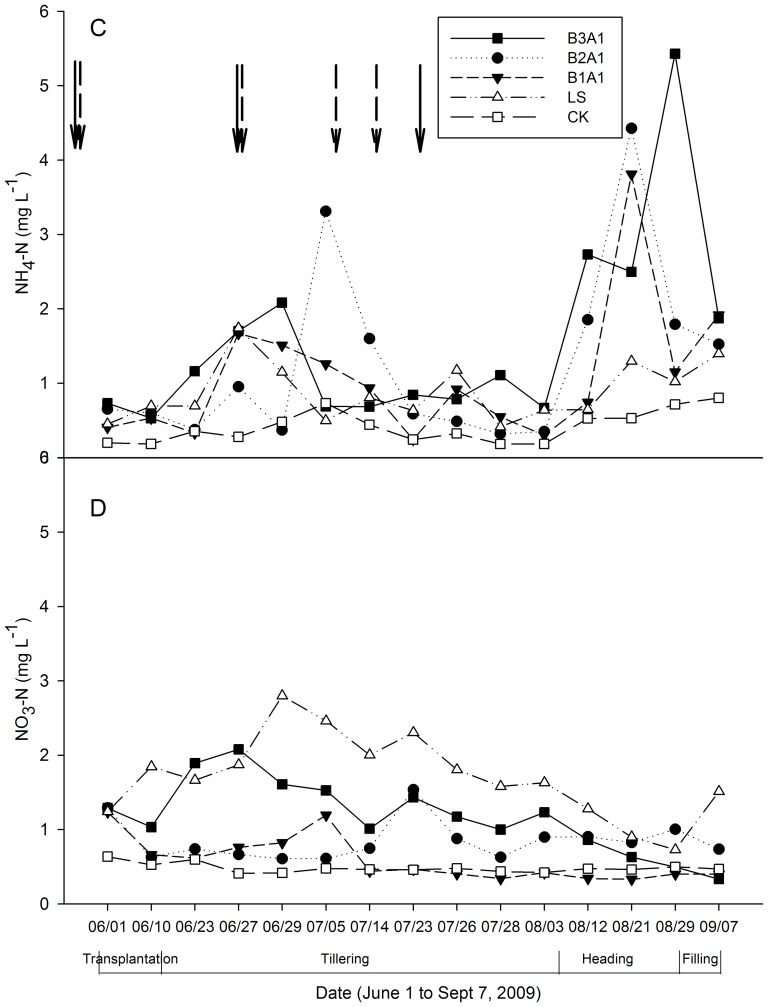
Figure 4. Concentrations of NH4-N and NO3-N in leachate at the 180 cm soil depth under different fertilization treatments.
C: NH4-N; D: NO3-N. The solid and long-dashed arrows indicate the date of fertilizer applications for organic treatments (B1A1, B2A1, and B3A1) and for the conventional treatment (LS), respectively. Bars represent standard deviations (n = 3).

