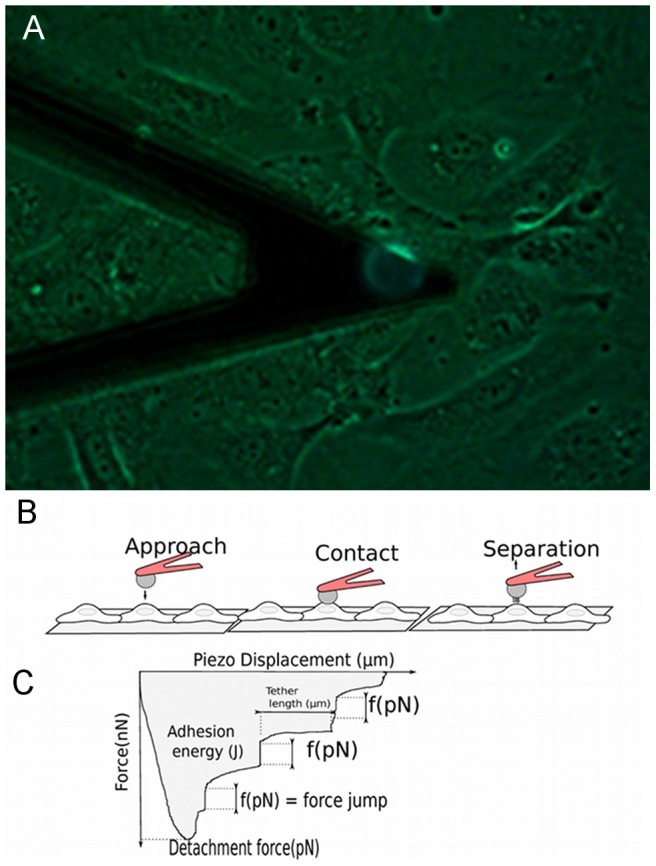
Figure 1. Interactions between cancer cells and ECs measured with AFM.

A) Photograph of the cantilever with attached fluorescent cancer cell above the HUVEC monolayer. White scale bar corresponds to 20 µm. B) Sketch of the approach-retraction method and typical retraction force curve in terms of the piezo displacement. The cancer cell approaches the EC monolayer at constant speed. Then the cell comes into contact with the EC during 10 seconds (under 1 nN applied force) to create several bond complexes over the adhesion area. The cantilever is retracted at constant velocity in order to detach the adhesive bonds. The retraction curve shows force jumps corresponding to the rupture force (f) of bonds. The adhesive energy (shaded area) represents the detachment work done by the cantilever to completely detach the cell from the substrate. The detachment force is the force necessary to stretch the cancer cell and the EC until bonds start to detach. Note that some force jumps can follow a plateau corresponding to tether formation.
