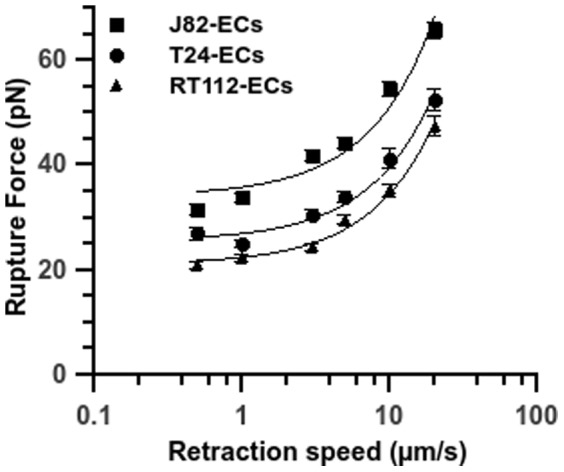
Figure 4. Rupture force vs. retraction velocity for different cancer cell lines.

Relationship between rupture force and retraction speed after 10s-contact between a TC and an EC on a HUVEC monolayer. Three cancer cell lines: T24 (full circle), J82 (full square) and RT112 (full triangle) interacting with the endothelium. Data are plotted as mean ± standard error of the mean. The line is just a guide for the eye.
