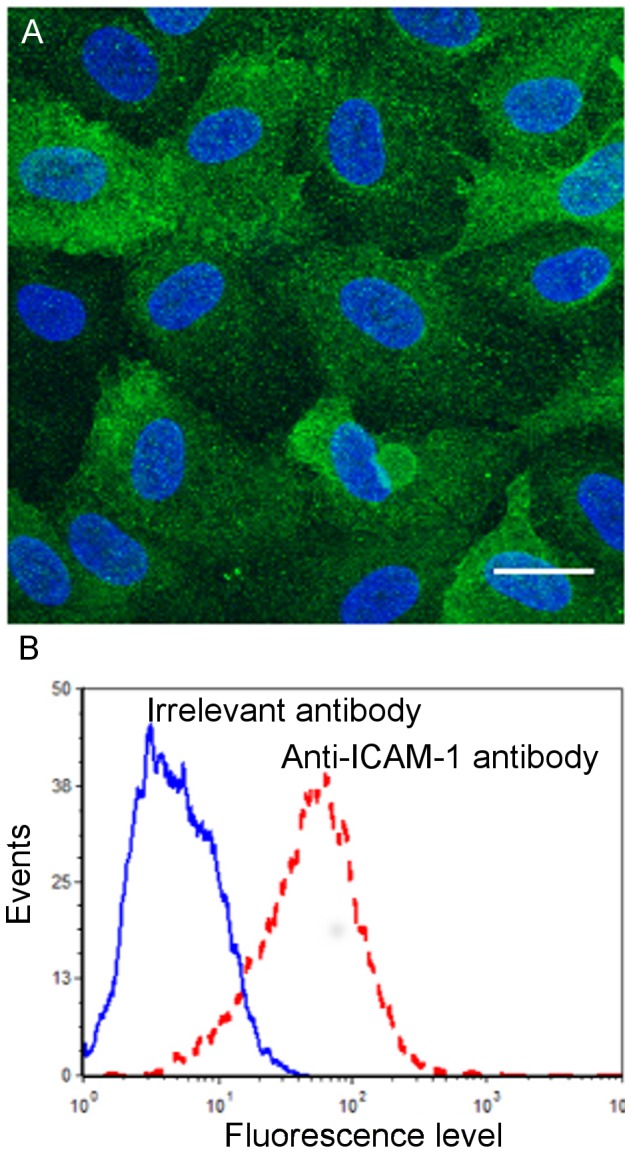
Figure 6. ICAM-1 expression on ECs.

A) Confocal microscopy image of an EC monolayer stained for ICAM-1 (green). HUVECs were fixed with PFA. Nuclei are stained in blue using DAPI. B) Quantification of ICAM-1 levels by FACS analysis (dashed line) in comparison with an irrelevant antibody (solid line).
