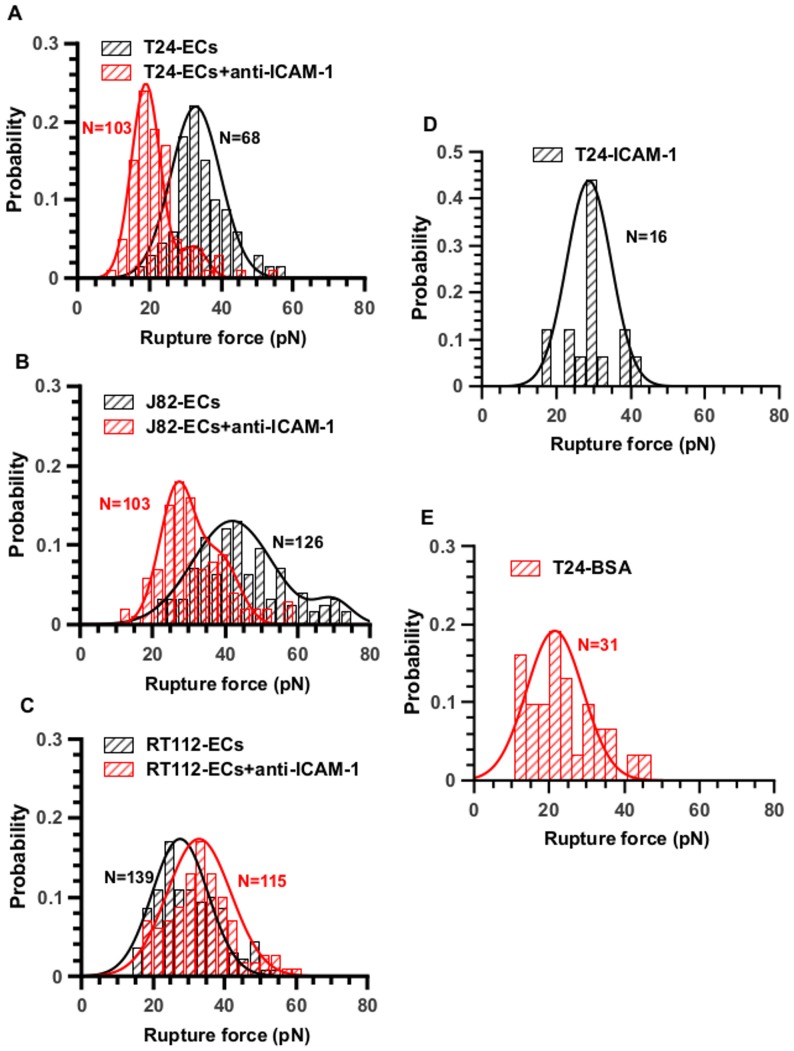
Figure 8. Distribution of rupture forces and effect of an anti-ICAM-1 antibody.
Effect of an anti-ICAM-1 antibody on cancer-EC interactions. Rupture force distributions are Gaussian with one or two peaks revealing the presence of receptor/ligand bonds or non specific interactions. Probability histograms of rupture force (V = 5 µm/s) for (A) T24-HUVEC, (B) J82-HUVEC, (C) RT112-HUVEC. Black histograms represent interaction cancer-cell and EC without antibody whereas red ones show the force distribution after using the antibody. Panels D (T24-ICAM-1) and E (T24-BSA) show the rupture force probabilities for T24 cells in contact with coated substrates. The number N of events is indicated on the histograms.

