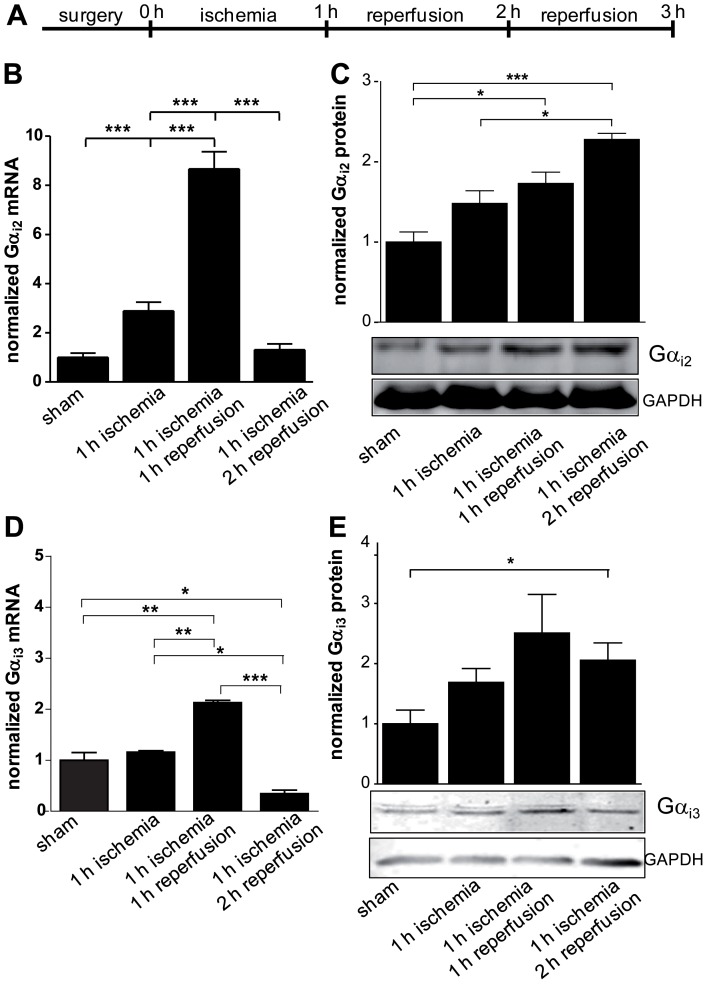
Figure 2. Increased expression of Gαi2 and Gαi3 during IR-injury.
a. Schedule of the IR model with one hour ischemia followed by one or two hour reperfusion. b. Surgeries were performed as indicated with C57BL/6 male mice (WT). After the procedures AAR was excised and transcript levels of Gαi2 were determined by quantitative PCR. c. Protein expression of Gαi2 was analyzed by immunoblotting using a Gαi2-specific antibody. Protein amounts were normalized to GAPDH. Protein amounts loaded were 60 µg. Shown are representative images. d. Transcript levels of Gαi3 after surgeries as described in (a) were determined by quantitative PCR. e. Protein expression of Gαi3 was analyzed by immunoblotting using Gαi3-specific antibodies. Protein amounts were normalized to GAPDH. Protein amounts loaded 60 µg. Shown are representative images. Data are shown as mean ± SEM (n = 3); statistic was calculated with one-way ANOVA, with Bonferroni post test; *P≤0.05; **P≤0.01; ***P≤0.001 as indicated.

