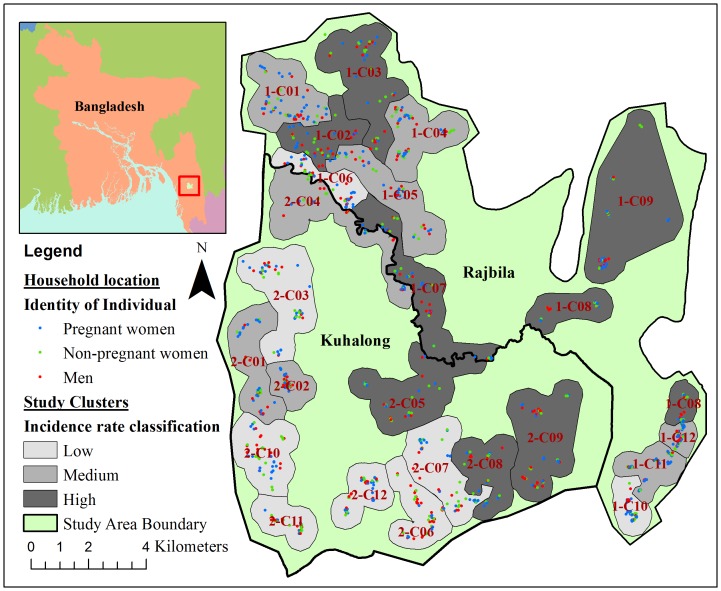
Figure 1. ArcGIS spatial analytical map for active surveillance of asymptomatic malaria.
Red, green or blue colored dots represent the household locations of participating men, non-pregnant women, or pregnant women, respectively. Background dark, medium or light grey color represents the highest, medium or lowest eight incidence clusters, respectively.

