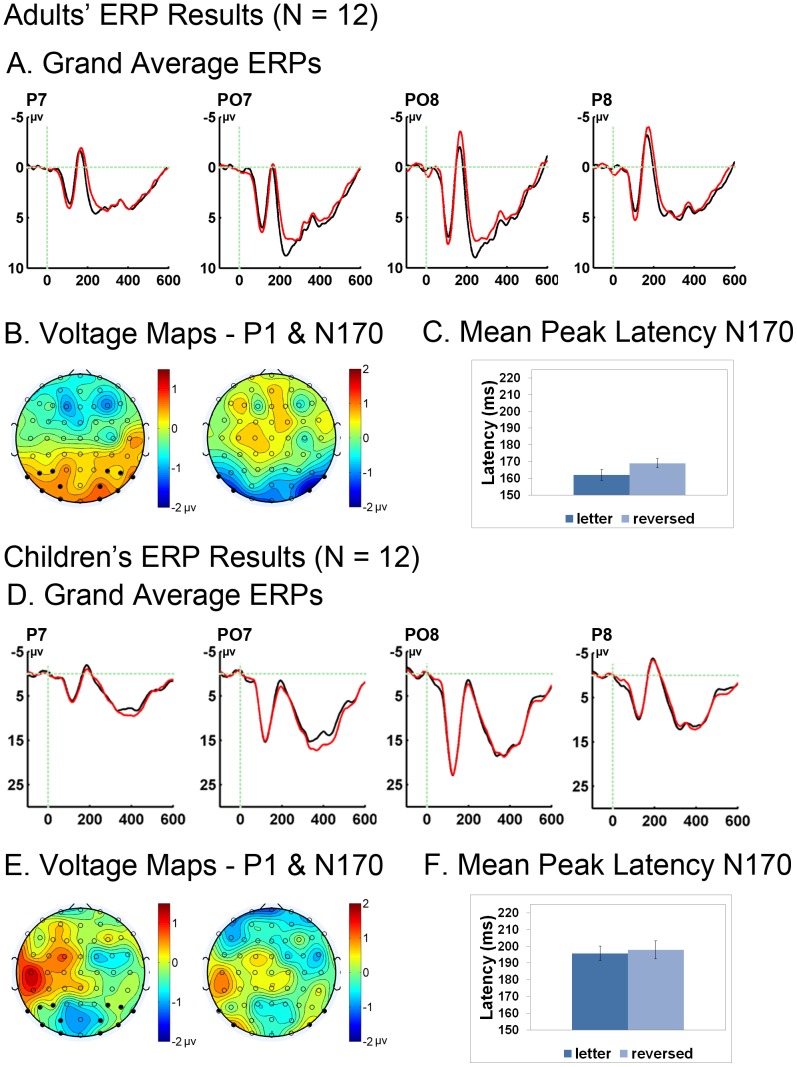
Figure 6. ERP Results.
ERP Waveforms and Voltage Maps. Grand average waveforms for the adults (A) and for the Children (D) showing the P1 and N170 differences present in adults, but not children. The distribution of these effects is depicted in voltage maps (B and E) showing the difference between normally-oriented letters and mirror-reversed letters (reversed – normal). Black dots on the voltage maps indicate electrode sites included in the mean amplitude analysis. Note the scale difference between the P1 and N170 epoch. C shows the peak latency difference between reversed and normally-orientated letters in adults where the latency is increased for mirror reversed letters. In F, children show a delayed peak latency that does not differ between the two conditions.

