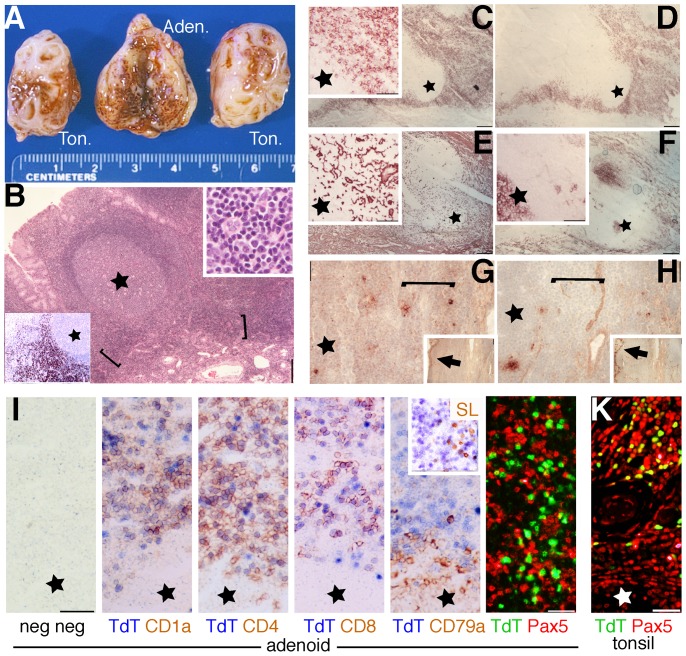
Figure 1. Phenotype and distribution of immature T cells in adenoids and tonsils.
A: macroscopic appearance of a representative sample of tonsils and adenoidal tissue. B: Low power (4x) image of a fixed and embedded adenoid, stained with Hematoxylin and Eosin. The brackets highlights the boundary between the stroma and the secondary lymphoid tissue (star = germinal center) where darker staining small lymphocytes gather. Left lower corner inset shows TdT+(brown) cells in sheets in an immunostained serial section (4x). Upper right inset: H&E detail of the bracketed area (40x). C-H: frozen adenoid serial sections (4x) stained for CD1a (C), CD1b (D), TE-7 (E), NGFR/p75 (F), and the anti thymic epithelium reagents RFD4 (G) and TE-4 (H) (brown, no counterstain). The insets in C, E and F show a magnified detail of the area occupied by immature T cells (40x)(also indicated by brackets). Star = germinal center. The insets in G and H show low power images (4x). The arrows highlight positive surface epithelium. I: frozen adenoid serial sections (40x) double stained for negative controls, TdT and CD1a, CD4, CD8, CD79a and surrogate light chain (SL; inset). Note the doublestaining in the upper half field, except for CD79a and SL. The last image is a double immunofluorescence image showing largely mutually exclusive distribution of Pax5 and TdT in adenoids in a fixed and embedded section. K: fixed and embedded tonsil section showing coexpression of TdT and Pax5 in immature B cell precursors.

