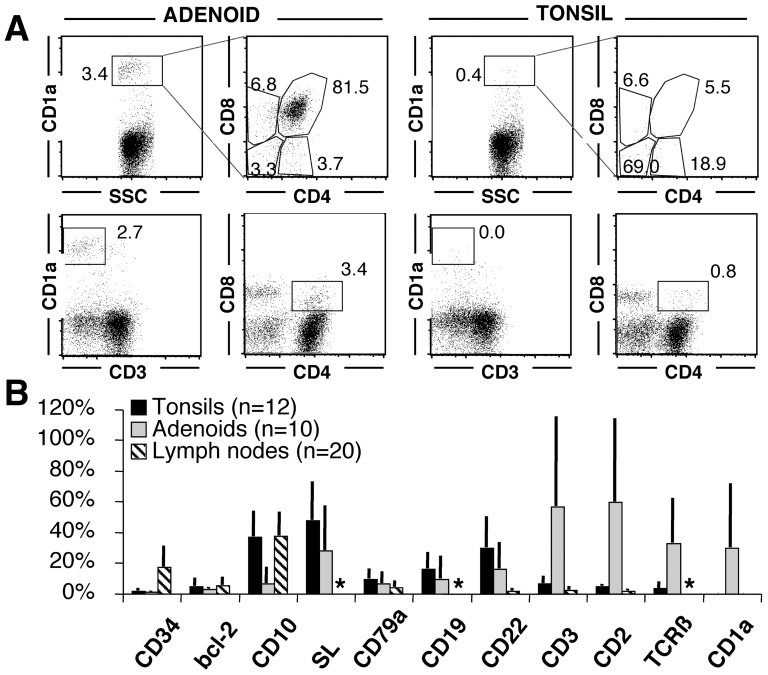
Figure 2. Phenotype of TdT+ cells in adenoids, tonsils and secondary lymphoid organs.
A: Adenoid and tonsil from the same individual, stained by flow cytometry for surface antigens, show in the adenoid only CD1a+, surface CD3-, double CD4 and CD8 positive immature T cells. The tonsil is devoid of such cells. The numbers indicate the percentage in each gate. CD2+ T cells were enriched by SRBC rosetting. B: The phenotype of TdT+ cells in 12 tonsils, 10 adenoids and 20 lymph nodes is plotted. Each marker has been counted on TdT+ cells and the mean ± SD is shown. The variability is due to dilution with TdT+ immature B cells. An asterisk marks analysis not done. Note the unique presence of CD1a+ immature T cells in adenoids.

