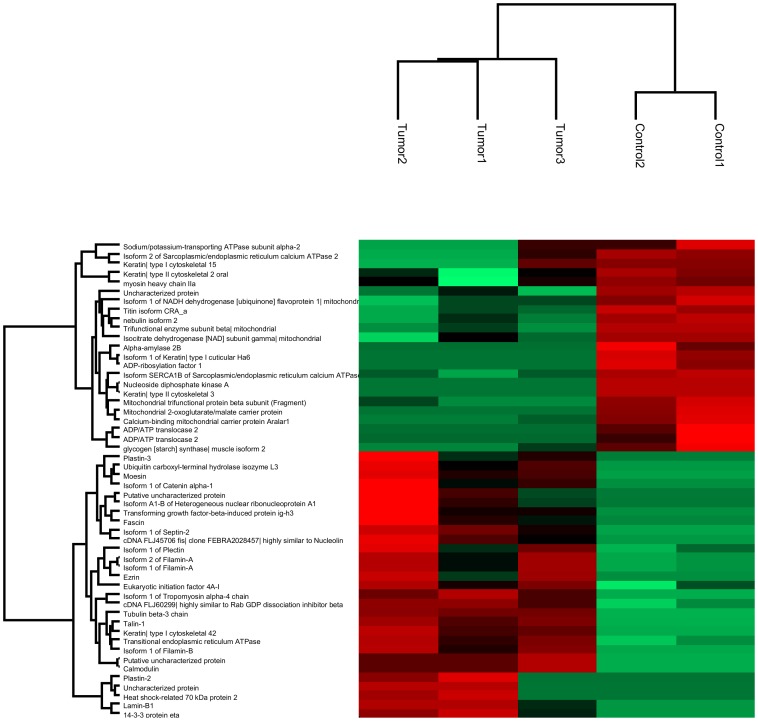
Figure 2. Bioinformatics analysis of differential expressed proteins in OSCC and control tissues identified by MS.
Clustering of significantly up- and down-regulated proteins (Fisher's exact test, p<0.05) in OSCC tissues compared to control tissues is shown as a Heat map, applying the Euclidian distance method and average linkage.

