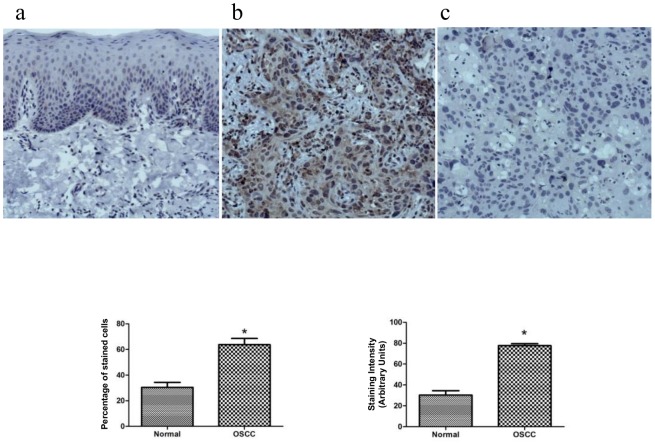
Figure 4. Expression of talin-1 in the human normal oral mucosa and OSCC tissues by immunohistochemistry (n = 10).
Talin-1 demonstrated a weak and restrict cytoplasmic immunoreactivity in the basal and suprabasal layers of the normal oral tissue (a), whereas broad positivity with variable intensity was found in the neoplastic cells (b). As expected, some immune and inflammatory cells expressed talin-1. Panel c represents the negative control. The graphics represent the % of positive expression cells and expression intensity between the normal and OSCC tumor tissues (n = 10, Student's t-test, * indicates p<0.05).

