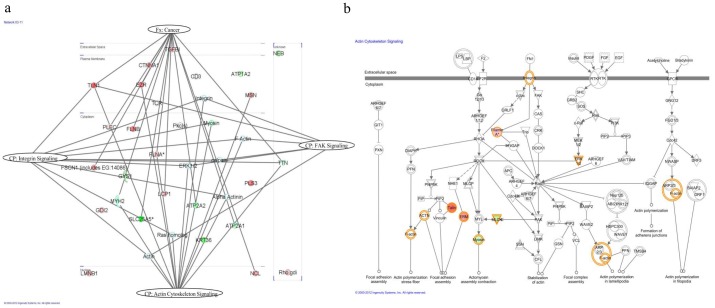
Figure 5. Pathway analysis of differentially expressed proteins.
(a) The highest score network generated by IPA comprised 23 differentially expressed proteins (up-regulated proteins are displayed in red, whereas the down-regulated proteins are in green) plus additional interacting molecules that were not identified in this study (white). The network revealed 15 proteins in the context of cancer. Actin cytoskeleton signaling, integrin signaling and FAK signaling represent canonical pathways with 13, 10 and 6 identified proteins of the network, respectively. The proteins were grouped according to the canonical pathway or function. Fx: function and Cp: canonical pathway. (b) Representation of the top canonical pathway of actin cytoskeleton signaling.

