
Figure 1.
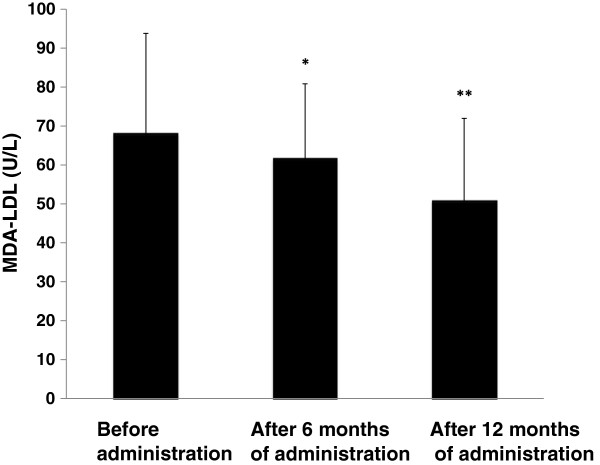
Change in plasma MDA-LDL concentration. The results are shown as mean±standard deviation. Comparison with the value before administration of the combination tablet. *p < 0.05, **p < 0.01 (paired t-test).
Official websites use .gov
A
.gov website belongs to an official
government organization in the United States.
Secure .gov websites use HTTPS
A lock (
) or https:// means you've safely
connected to the .gov website. Share sensitive
information only on official, secure websites.
Change in plasma MDA-LDL concentration. The results are shown as mean±standard deviation. Comparison with the value before administration of the combination tablet. *p < 0.05, **p < 0.01 (paired t-test).