
Fig. 2.
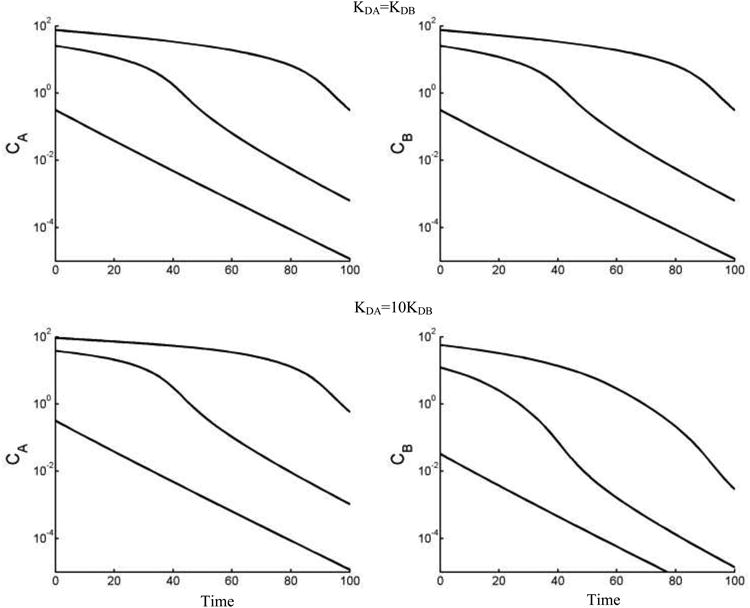
Simulated concentration-time profiles for escalating IV bolus doses (100, 500, 1000 units for both A and B) using TMDD model with two ligands competitively binding to the same target. Vc = 10, kelA = kelB = 0.01, kptA = kptB = ktpA = ktpB = 0, CA0 = CB0 = 0, kintA = kintB = 0.1, Rtot0 = 50, kdeg = 0.02. For upper two panels, KDA = KDB = 1. For lower two panels, KDA = 1, KDB = 0.1. Other parameters used for simulations are listed in Table 1. Simulations were performed in MATLAB using the algebraic solution of equilibrium equations.