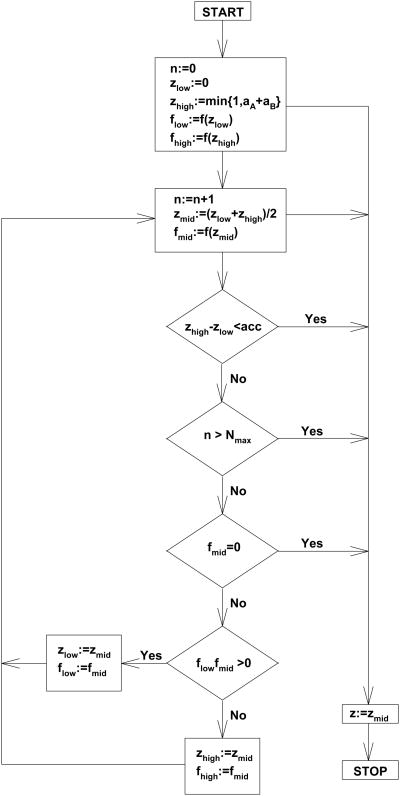
Fig. 3.
A flow chart illustrating the bisection algorithm for solving equation f(z) = 0. The START and STOP steps denote the beginning and end of the algorithm, respectively. The rectangular boxes represent the assignment steps whereas the diagonal boxes refer to conditional statement with two possible outcomes Yes (if condition is true), and No (if condition is false). The arrows indicate the next steps. The meanings of the symbols aA, aB, acc, and Nmax are explained in the methods and results.

