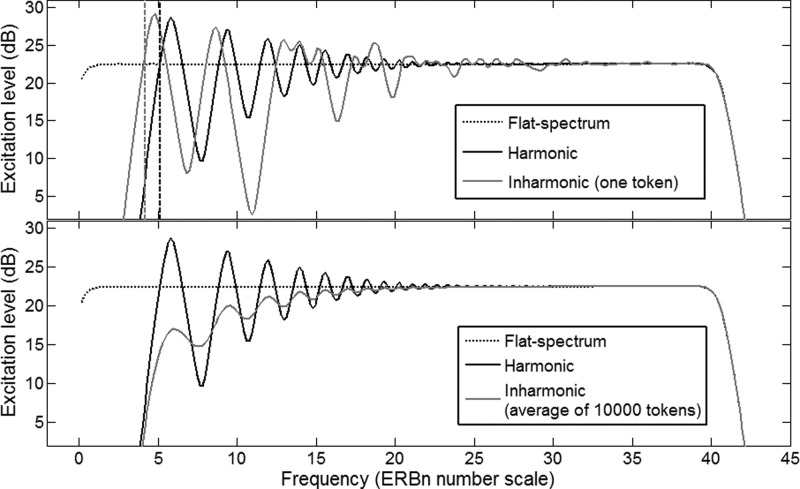
Figure 2.
Excitation patterns of harmonic and inharmonic complexes based on a nominal F0 of 200 Hz. (Top) Peaks resulting from two inharmonic partials close to each other are not as pronounced as dips resulting from two inharmonic partials distant from each other. (Bottom) Averaging the patterns over 10 000 inharmonic tokens reflects this predominance of spectral dips over spectral peaks in the resolved region.

