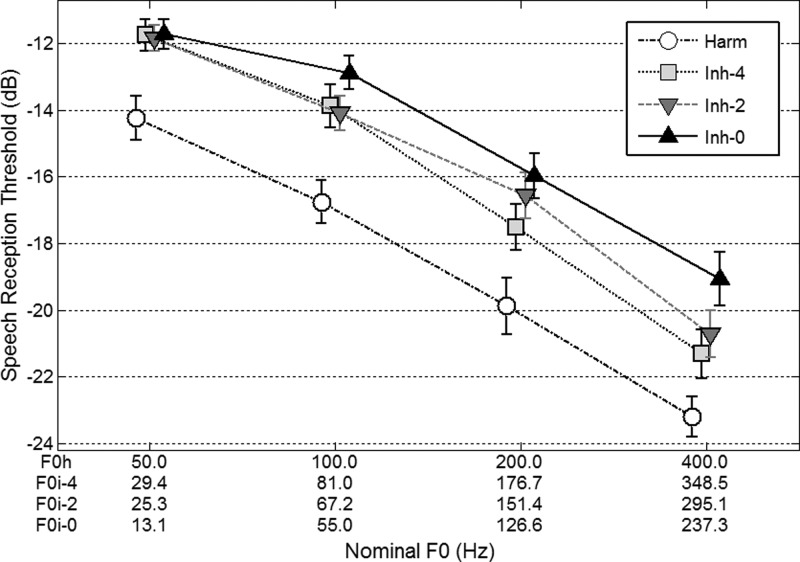
Figure 6.
Speech reception thresholds measured in experiment 2 for an unprocessed, naturally intonated, voice masked by harmonic, inharmonic, and partially inharmonic complexes. Complexes had different nominal F0s such that the size of their spectral dips relative to that of their spectral peaks was similar to harmonic spectral templates at 50, 100, 200, and 400 Hz.

