Abstract
A microfabricated calorimeter (μ-calorimeter) with an enclosed reaction chamber is presented. The 3D micromachined reaction chamber is capable of analyzing liquid samples with volume of 200 nl. The thin film low-stress silicon nitride membrane is used to reduce thermal mass of the calorimeter and increase the sensitivity of system. The μ-calorimeter has been designed to perform DC and AC calorimetry, thermal wave analysis, and differential scanning calorimetry. The μ-calorimeter fabricated with an integrated heater and a temperature sensor on opposite sides of the reaction chamber allows to perform thermal diffusivity and specific heat measurements on liquid samples with same device. Measurement results for diffusivity and heat capacitance using time delay method and thermal wave analysis are presented.
INTRODUCTION
Microfabricated calorimeters (μ-calorimeter) have been developed for “Lab-on-a-chip”, medical and biochemical applications. The μ-calorimeter serves to characterize biochemical samples and interactions with high sensitivities while only using micro or nano-liter scale sample volumes.1 The μ-calorimetry has been used to investigate DNA folding-unfolding processes, molecular recognition, isothermal titration, characterization of the thermal properties of liquid samples (heat capacity, diffusivity, and conductivity),2 and for many other lab-on-a-chip applications.3 A μ-calorimeter consists of three parts: A reaction chamber, a heater, and a temperature sensor. Based on the configuration of the reaction chamber, μ-calorimeters are classified into two categories: A closed reaction chamber configuration with a fully enclosed reaction/detection chamber4 and an open reaction chamber configuration, in which the sample is placed on a membrane and partially exposed to the environment.5 The open reaction chamber configuration, in contrast with the fact that it has an incomplex fabrication to achieve an excellent thermal resistance, suffers from the evaporation of volatile liquid samples and sample handling issues (manual spotting).6 On the other hand, the closed reaction chamber configuration is more complex and typically suffers from a large thermal mass (heat capacity) owing to the use of bulky encapsulating materials such as Polydimethylsiloxane (PDMS) or glass covers,7 resulting in reduced sensitivity in temperature measurement.
A typical μ-calorimeter uses an electrical heater to apply heat to a sample and a temperature sensor to measure resulting temperature changes. To accurately determine the thermal energy exchange of the reaction or interaction, the contact of the heater and the temperature sensor to the sample has to be thermally efficient. Integration of these thermal components using micromachined methods has advantages as they ensure intimate thermal contacts by design. However, conventional lithography-based methods are limited for use in substantially planar surfaces and are particularly difficult to use over 3-dimensional structures or cut-out surfaces.8 Mostly, the heater and/or the temperature sensor are integrated on the same membrane-based planar surface,9 or the heater and the sensor are fabricated on separate substrates with an off-chip bonding process to form the calorimeter chamber.10 To simplify the integration of the heater and the temperature sensor, the 3ω (or AC mode) method uses a single metal strip as the heater and the temperature sensor. The 3ω has been extensively used for thermal conductivity measurements, which still requires a bulky material to encapsulate the reaction chamber and it yields to increase the thermal mass of the system and decreases the detection sensitivity.
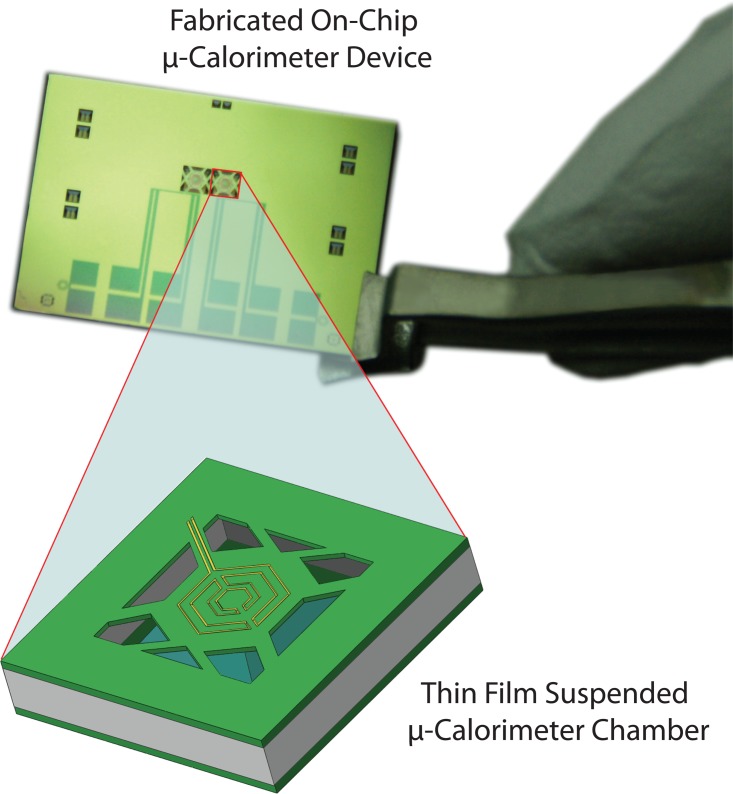
In this paper, we present a μ-calorimeter with suspended three-dimensional (3D) closed reaction chambers with a heater and a temperature sensor integrated on the opposite sides of each reaction chamber. Figure 1 shows a fabricated calorimeter with two chambers for differential calorimetric measurements. The details of each reaction chamber are shown in the zoomed-in schematic in Figure 1. Each reaction chamber is suspended and fully enclosed by a low-stress silicon nitride (SixNy) membrane and a polyimide thin film forming the opposite sides of the chamber. The thin film encapsulating structures, in contrast to other bulky closed chamber configuration μ-calorimeters, which are of the order of millimeters in thickness.7, 11, 12 As a result, the thermal mass of the fabricated reaction chamber is about 3 orders of magnitude smaller compared to the conventional bulky chambers, directly resulting in a corresponding increase in temperature detection sensitivity. In this device, the heater and the temperature sensor are integrated on different sides of the reaction chamber such that the sample can be placed between the heater and the sensor. Configuration of heater and sensor on fabricated device creates the capability of performing different calorimetric measurements such as differential scanning calorimetry (DSC),9 thermal wave analysis (TWA),13, 14 3-ω technique,15 and titration16 without any change in measurement setup. In addition, the heat flux directly travels through the sample inside the chamber and with minimal fringing effects of heat flux. This enables excellent fit with a 1-D heat model used to extract thermal properties of the samples, as the boundary conditions used to drive the relations for thermal properties.17 In contrast, calorimeters that have a heater and a temperature sensor on the same side have non-negligible fringe effects and have to employ 3D models specific to device configuration to accurately extract thermal properties. These also result in lower detection sensitivity since heat fluxes diffuse radially. The measurement results for thermal properties (thermal diffusivity and specific heat) of liquid samples using fabricated μ-calorimeter are demonstrated.
Figure 1.
A 3D micromachined on-chip calorimeter with suspended reaction chambers is shown. Each calorimeter has two identical chambers for differential measurements, and each chamber has two microfluidic inlets and one outlet.
MATERIALS AND METHODS
Reaction chamber design
A wide range of materials and designs have been used for the fabrication of on-chip μ-calorimeter chambers. The μ-calorimeters with closed reaction chambers are made for the characterization of liquid samples of volumes ranging from a few microliters to few nanoliters, where evaporation of any of the sample is resulting in considerable measurement errors.7 Previously reported methods for fabricating closed reaction chambers for μ-calorimeters have used soft lithography techniques, isotropic etching of micro cavities,12 off-chip wafer bonding processes10 or made using polymer thin films.7 Effective use of calorimetric techniques requires quasi adiabatic conditions in the μ-calorimeter, which requires good thermal isolation of the reaction chamber from the ambient and substrate. Another desirable aspect of a μ-calorimeter is the negligible thermal mass of the reaction chamber compared to that of the sample to enable calibration-free characterization.18
Aiming to reduce the thermal mass, the reaction chambers in this work have been designed and fabricated using a SixNy thin film and a thin polyimide film. The reaction chamber is also fully suspended from silicon handle to minimize the thermal loss to the substrate by thermal conduction. The reaction chamber has been 3D-micromachined using an anisotropic wet chemical etching process. The reported fabrication method eliminates the off-chip wafer bonding processes and keeps the device fabrication robust and simple, while achieves the low thermal mass and high thermal insulation result in high sensitivity of detection.
Device fabrication
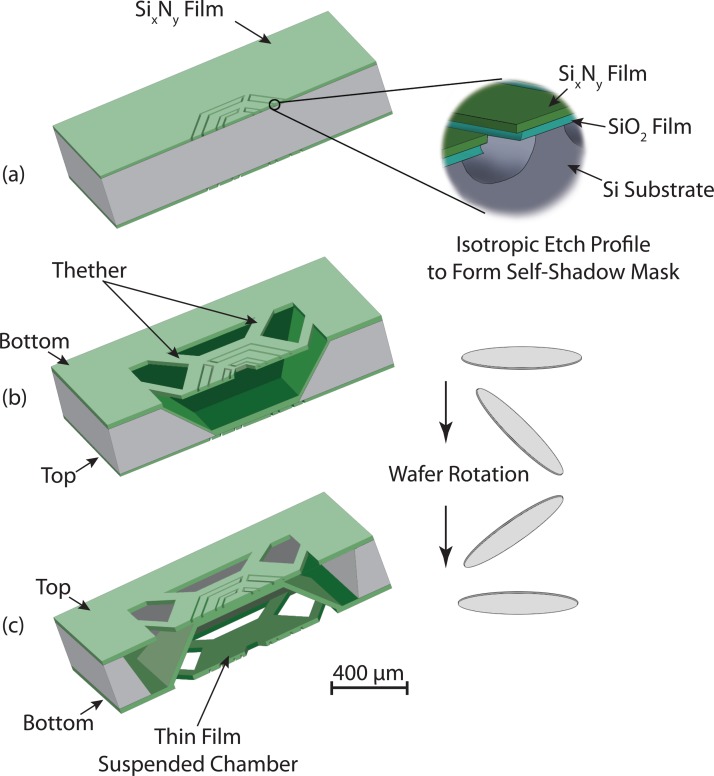
Micromachining of 3D structures using conventional photolithographic methods and the integration of thermal components (heater and sensor) on thin film suspended structures are yet challenges. In this work, we used a self-shadow masking process to form the reaction chamber using a combination of isotropic and anisotropic wet etching techniques of silicon. The main objectives for the process design are direct integration of the thermal components to the reaction chambers and wafer scale fabrication of 3D thin film chambers. Our μ-calorimeter device was fabricated on a 300 μm thick silicon (100) wafer with thermally grown silicon dioxide layers and low-stress SixNy thin films deposited by low-pressure chemical vapor deposition (LPCVD) at both sides of wafer. The process flow for device fabrication is outlined in Figure 2, shows the various fabrication processes in three major steps, which are described in Subsections II B 1–II B 3 in details.
Figure 2.
The process flow for 3D microfabrication of the calorimeter device. (a) Electrode patterns are printed symmetrically on both sides of the wafer and isotropically etched to form self-shadow masks, (b) a first anisotropic wet chemical (KOH) etching on the bottom surface of the wafer defines the reaction chambers, and (c) second KOH etch to define suspended tethers of SixNy on the top surface.
Design and fabrication of the thermal components
In thermal microfluidics systems, different heat sources such as preheated liquids,19, 20 Joule heating,21, 22, 23, 24, 25 microwave heating,26, 27, 28 and chemical reactions29 have been used. Resistive heating (Joule heating) is selected as a heat source in this work to achieve homogeneous heating with a wide operational temperature range, better heat control compared to other methods30 and for ease of integration onto thin film substrates.31
An integrated resistive temperature detector (RTD) is used for the temperature sensor in this work. The RTD temperature sensor has a number of advantages such as stability,32, 33 high accuracy,32 linearity,32 reproducibility,34 and ease of fabrication. The RTD works on the principle that the resistance of the RTD changes in relation to the RTD temperature. Platinum, nickel, copper, and nickel-iron are common materials used in the RTD sensors. Platinum has a linear resistance-to-temperature response over a wide range of temperature (−50 to 250 °C) and long term stability. The linear regime of nickel is less (0–150 °C)35 but adequate for most biochemical reactions. In this work, the nickel thin film is deposited using an evaporation process. Nickel has a higher temperature coefficient of resistance (TCR) and low evaporation temperature is required to deposit using an evaporation process compared to platinum.
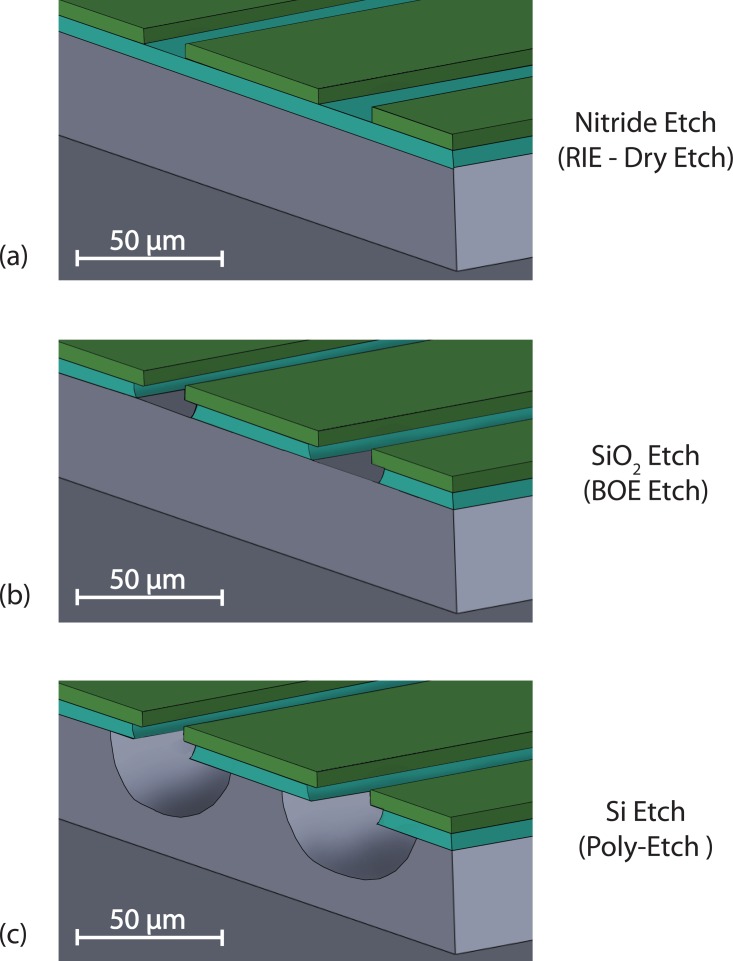
The heater is designed with a serpentine structure to achieve a uniform planar heat source to satisfy the constant heat flux boundary conditions, which are used to drive the heat transfer equation through the liquid sample in the chamber.17 The RTD sensor is also designed symmetrically and aligned with the heater to detect the heat at the other side of the chamber. The process to form the heater and RTD patterns in both sides of the wafer is shown as the first step in the fabrication process flow in Figure 2a. We developed a novel metal patterning process to place the thermal components on the reaction chamber to resolve the difficulties of lithographic patterning over 3D structures of the microfabricated SixNy chamber. We first print serpentine grooves symmetrically on both sides of the wafer using a double-sided mask aligner. After patterning serpentine structures, the silicon nitride and silicon dioxide layers are etched by reactive ion etching (RIE) (Figure 3a) and buffered oxide etching (BOE 6:1) (Figure 3b, respectively. The exposed silicon is undercut using an isotropic wet silicon etch process (Poly Etch 95%, KMG Chemicals) to form the SixNy overhangs. The cross-sectional view of the isotropic silicon etch is shown in Figure 3c. The SixNy overhang is used as an integrated self-shadow mask in a blanket metal evaporation process (last step) to isolate thermal components from the substrate.
Figure 3.
The process flow for the integration of the heater and the temperature sensor on the thin film chamber. (a) The SixNy film is etched by reactive ion etching, (b) the silicon dioxide is etched with BOE isotropic wet etching, and (c) the poly etch is used to isotropically undercut the silicon.
Chamber and microfluidic channels fabrication
After the isotropic silicon etch on the both sides of the silicon wafer, a 0.5 μm thick low-stress LPCVD SixNy film is deposited to protect the exposed silicon. The reaction chamber and microfluidic channels are patterned on the bottom surface (heater side) of the wafer as shown in Figure 2b. An anisotropic silicon wet etch (potassium hydroxide, KOH, 30% w/w) is used to etch the silicon. After the first KOH etch process. Subsequently, another LPCVD process is used to deposit 0.5 μm thick low-stress SixNy. The deposited SixNy film at this step is used to form side walls of the reaction chambers. To suspend and thermally isolate the reaction chambers from the silicon substrate, the top surface (sensor side) of the wafer is patterned and etched with another anisotropic KOH silicon wet chemical etching process as is shown in Figure 2c.
The resulting suspended thin film chamber configuration allows maximum thermal insulation from the surrounding environment. The thin film SixNy walls reduce the thermal mass of the chamber and increases the sensitivity of the sensor. The entire micromachining process is fabricated monolithically from a silicon substrate avoiding any wafer bonding processes. The μ-calorimeter chip is designed with two identical chambers next to each other to be able to perform differential scanning calorimetry. Each chamber has two microfluidic inlets and one outlet, which will be used in future work to study heat exchanges in mixing and reactions.
Metallization and polyimide bonding
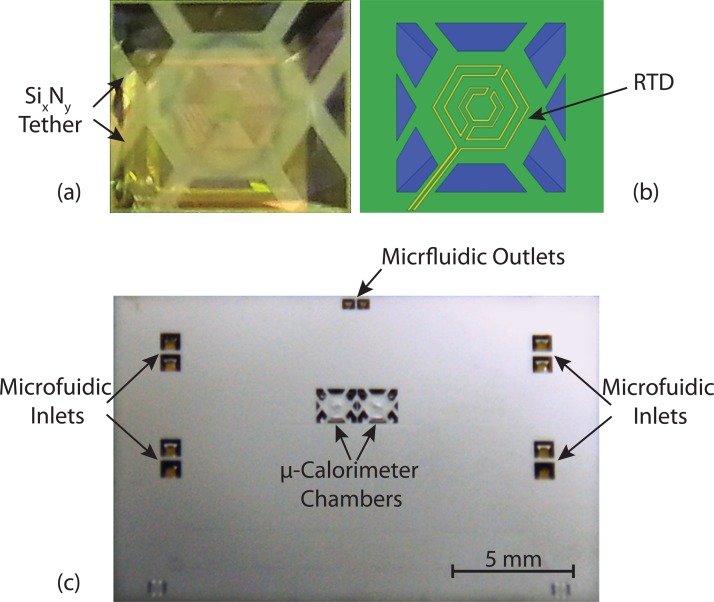
At the final step of the microfabrication process, the thermal components are integrated on the device by a blanket deposition of nickel on both sides of the wafer. A 30–70 nm thick film of nickel is thermally evaporated on each sides of the wafer to achieve the designed heater/RTD resistance of 1-4 kΩ. Figure 4 shows the fabricated chamber before and after metal deposition. After metallization for the thermal components, a 25 μm polyimide film is used to seal the bottom of the wafer using a silicone adhesive (70 μm total), forming a fully enclosed reaction chamber, as shown in Figure 4. The total volume of the reaction chamber to contain a liquid sample is designed to be 200 nl.
Figure 4.
The fabricated chamber and the final device after metallization are illustrated. (a) shows the optical image of the fabricated chamber after anisotropic wet chemical etching, (b) shows the top view of the fabricated chamber, and (c) shows the final calorimeter chip after metallization.
Device characterization
RTD sensor characterization
The electrical resistance value of a 30–70 nm thick nickel film on the wafer is 1–4 kΩ, respectively. The resistance change of a RTD is a function of temperature given by the simplified Callendar–Van Dusen equation36
| (1) |
where the Rrm is the RTD resistance at room temperature, αr is the TCR of the nickel RTD, and ΔT is temperature change.
The TCR for the nickel RTD is measured using a HAAKE thermal bath by sweeping the bath temperature range from 10 to 50 °C. The measured resistance of the nickel film as a function of temperature shows excellent linearity (R2 = 0.9999) within the calibration range. From the slope of the measured values, the measured αr of the sensor is 2.58 × 10⁻³/ °C. The αr for bulk nickel has been reported to be 6 × 10⁻³/ °C.37 The αr is a function of the film thickness to the mean free path of electrons in the film38 and the scattering at the film surface and the grain boundaries of deposited metal.39 The αr is changing based on different deposition parameters and film thinness.
Increasing the thickness and thermal annealing of the nickel film may increase the αr.
Using a commercial RTD sensor (Pt-100) at the same time as the calibration test, the accuracy of the RTD over the measured temperature range was calculated to be 2.36%. The resolution of temperature measurement with RTD is limited by the Johnson–Nyquist thermal noise.40, 41 From calculated thermal noise, 8.17 × 10⁻⁶ °C resolution for the temperature measurement with bandwidth of 28.5 Hz for fabricated device is expected. However, the measurement noise of the preamplifier and source meter far exceeds this noise floor and results in a measurement temperature resolution of 2 × 10⁻³ °C. An 1 mA DC is used as excitation current of the sensor with a 4-wire measurement configuration to minimize the effects of contacts and connecting wires on temperature measurements.
μ-calorimeter DC characterization
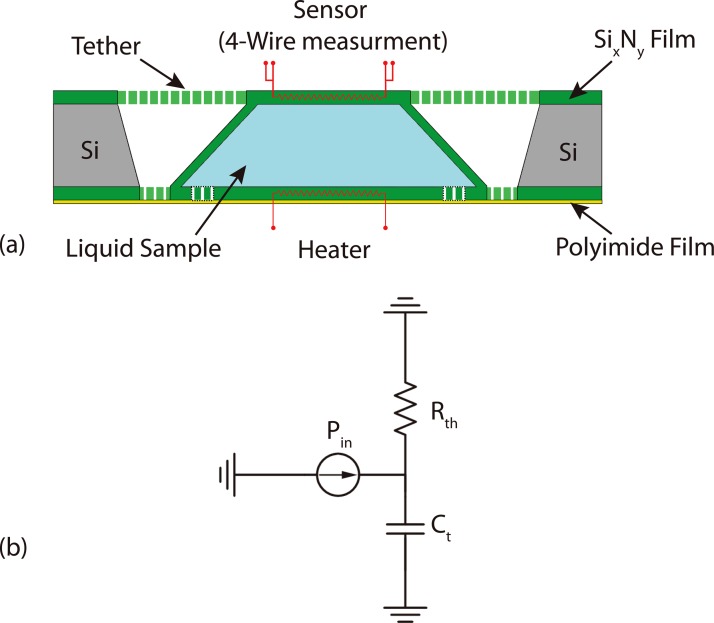
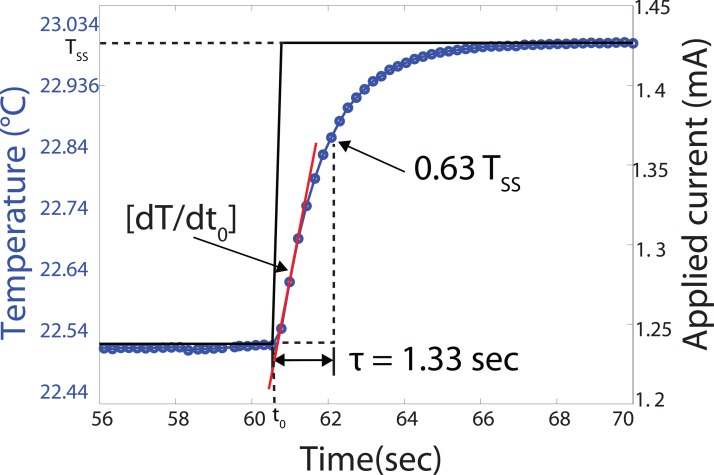
A first-order lumped element model is used to model the μ-calorimeter and the loaded sample, as shown in Figure 5. A step function response is used to extract thermal parameters such as the thermal resistance, the thermal mass, and the equilibrium time constant of the system. A heat pulse is generated at the heater by applying a 1 mA current, and travels through the liquid sample. The temperature response (step response) as well as measured DC parameters of the calorimeter is shown in Figure 6. Two Keithley 2400 source/meters are used as a current source and a 4-wire resistance measurement unit for the heater and the sensor, respectively.
Figure 5.
(a) Shows the calorimeter reaction chamber cross sectional view and (b) shows the lumped parameter circuit model where the Pin is the input power, the Rth is the total thermal resistance of the fabricated calorimeter, and the Ct is the thermal mass of the system.
Figure 6.
Shows the DC step response of the μ-calorimeter and the calculation of the DC parameters of the calorimeter from the output data. Tss is the steady state temperature response, to the input DC step, measured at the sensor. The Rth = 58.87 K/W is calculated from over input power, thermal time constant (τ = 1.33 s) based on the Eq. 2 is the time it takes the temperature rises to 0.63 Tss and the thermal mass (Cp = 6.63 × 10⁻³ J/K) is the input power times the inverse of the slope at t = 0.
The step response of the temperature change can be expressed as
| (2) |
where ΔT is the temperature change, a and b are fitting parameters obtained from the measured data, and t is time.
From the step response, the thermal resistance, thermal mass, and the time constant of our μ-calorimeter are 58.87 K/W, 6.63 × 10⁻³ J/K, and 1.33 s, respectively. These DC parameters are used for the DC thermal characterization of samples such as water, glycerol, and ionic liquids.
EXPERIMENTAL RESULTS AND DISCUSSIONS
Our μ-calorimeter is designed to integrate different calorimetry methods capabilities in a single device using 3D micromachining of a suspended chamber on a silicon wafer. The fabricated calorimeter is designed to perform DC calorimetry, AC calorimetry (transient), and TWA. The fabricated μ-calorimeter has two identical chambers with separate microfluidic channels, one as the calorimeter chamber and other as the reference chamber, which makes it possible to perform differential calorimetry (e.g., DSC) as well. The methods and the experimental setup to measure different thermal properties of liquid samples are described in this section using different calorimetric methods. The thermal properties of Deionized (DI)-water, glycerol, ionic liquid samples are measured and compared with literature values. The measurements are all performed in stationary condition to avoid any external flow and its impact on the measurement.
Thermal diffusivity measurement
The 3ω method using the phase change measurement for liquid samples has been commonly used for the thermal diffusivity measurement.42 However, this method requires calibration of the device with various samples of known thermal diffusivity to fit the two unknown parameters. In this paper, the non-steady-state (transient) method is used to measure the thermal diffusivity of liquid samples. The laser flash method developed by Parker et al.43 is a commonly used non-steady-state method. Although this method has been used to measure the diffusivity of both solid and liquid samples, the experiment requires no heat loss to surroundings (adiabatic condition). Other researchers have further developed the method for non-adiabatic conditions due to radiation44, 45 and a heat pulse width effects on the measurements.46 In our case, the heat loss mechanism is more complex than the laser flash method. To avoid the complex analysis for the thermal diffusivity measurement, we adapted the heat penetration time measurement method.17 The principle of the heat penetration time measurement is to apply a constant continuous heat flux to the one side of the sample, and to measure the time delay to reach the other side, where the sensor is located. The time delay can be expressed as17
| (3) |
where L is the length of the sample in the direction of the heat flux and α is the thermal diffusivity.
The time delay for the heat to travel across the reaction chamber in this work is typically a few hundred milliseconds. Since the time constant for our μ-calorimeter is 1.33 s, the measurement satisfies the requirement of quasi-adiabatic condition.
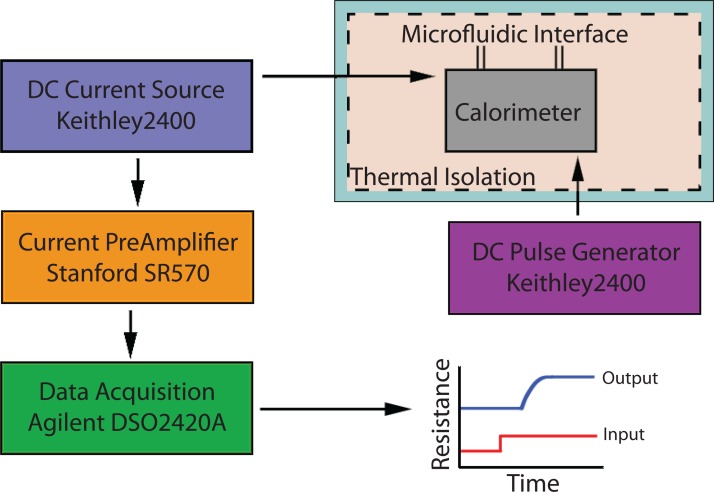
In the time delay thermal diffusivity measurement method, the μ-calorimeter and microfluidic pumps are placed in an enclosure to reduce the ambient effects. The DC source (Keithley source/meter) is used to apply a current pulse to the heater. At the sensor side, the other DC source (a second Keithley source/meter) is used to apply constant excitation current to the RTD sensor and measure the temperature change by monitoring the resistance change. To amplify the signal and increase the detection limit and resolution, a low noise current preamplifier (Stanford SR570) was used to amplify the current signal and convert it to a voltage signal. The output signal is monitored and recorded by a LabView program controlling an oscilloscope (Agilent DSOX2024A). The program ensures the synchronization between the input pulse to the heater and data acquisition at the sensor side. Figure 7 shows the measurement setup for the time delay method.
Figure 7.
The experimental setup for the time delay method to measure the thermal diffusivity of liquid samples with the on-chip μ-fabricated calorimeter.
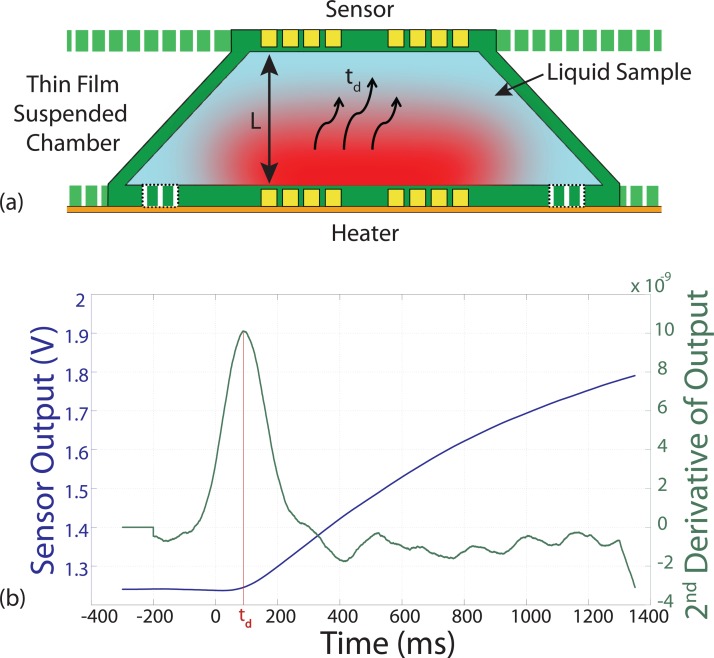
The typical time delay measurement is shown in Figure 8a. To determine the time the temperature changes arrives at the sensor, the maximum of the second derivative of the temperature profile is used as shown in Figure 8b. Although the thickness of the sample is approximately the thickness of the wafer, which is 300 ± 5 μm, we used DI-water with a known diffusivity47 at 25 °C to calibrate the thickness of our device. The time delay, t0, can be expressed as
| (4) |
where p is a correction parameter for the chamber thickness.
Figure 8.
The results of the time delay method to measure thermal diffusivity are presented. (a) The cross-sectional view illustrating the heat flux from the heater to the sensor across the liquid sample and (b) time-signal of temperature recorded at the temperature sensor and its second derivative to calculate exact time of arrival of the heat pulses at the sensor.
With the DI-water sample, p is found to be 0.89, which means the effective distance between the heater and sensor is 270 μm. Using this correction factor, the thermal diffusivity of glycerol is measured (9.94 × 10⁻⁸ m2/s). The measured values of thermal diffusivity show good agreement (<8% error) with values reported in literature.48
Specific heat measurement
TWA was first introduced by Garden et al.1 to measure the specific heat of a material. When an AC voltage with an angular frequency ω is applied to a heater, the power from the Joule heating results in 2ω frequency, which can be expressed as
| (5) |
where A is the amplitude of the current, R is the resistance of the heater, and ω is angular frequency of the applied AC voltage to the heater.
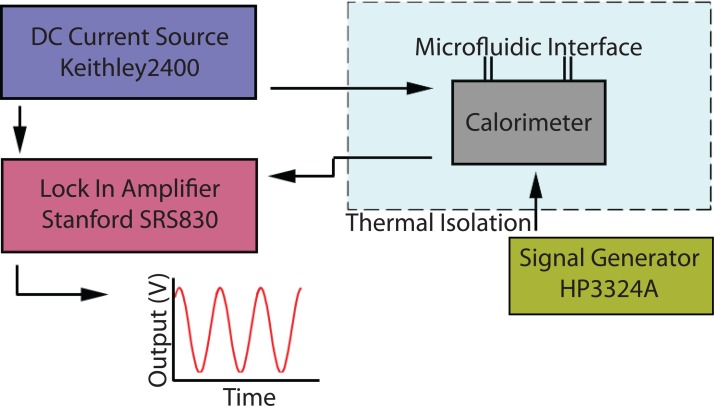
When the alternating power is applied to the heater, the temperature of the sample is raised and this changes the resistance of the heater, which generates the 3ω component of temperature at the heater. This 3ω component is measured in the typical single-strip heater and the sensor configuration. In this work, the 2ω component of the heat is measured at the sensor for measuring the heat capacitance of the sample. The measurement setup for performing TWA using the fabricated μ-calorimeter is shown in Figure 9.
Figure 9.
The experimental setup for thermal wave analysis to measure the specific heat of liquid samples with the μ-calorimeter.
An AC source voltage 3 Vpp with frequency from 0.01 Hz to 0.1 Hz is applied to the heater using a function generator (HP 3324A) with a frequency increment of 0.005 Hz between each measurement. To measure the temperature change at the sensor, a DC source (0.1 mA sources current) is used with a source/meter (Keithley 2400 source/meter). The output voltage from the sensor is measured using a lock-in amplifier (Stanford Research Systems SRS830). A LabView program was used for data acquisition and to synchronize all sources and measurement units.
Two conditions have to be satisfied for TWA. First, the temperature within the sample has to be homogenous and second, the system has to maintain the quasi-adiabatic condition.1 The quasi-adiabatic condition is satisfied if
| (6) |
where is diffusion time of the heat into the sample, ω is excitation frequency in the heater, and τ is the thermal relaxation time of the sample to the environment.
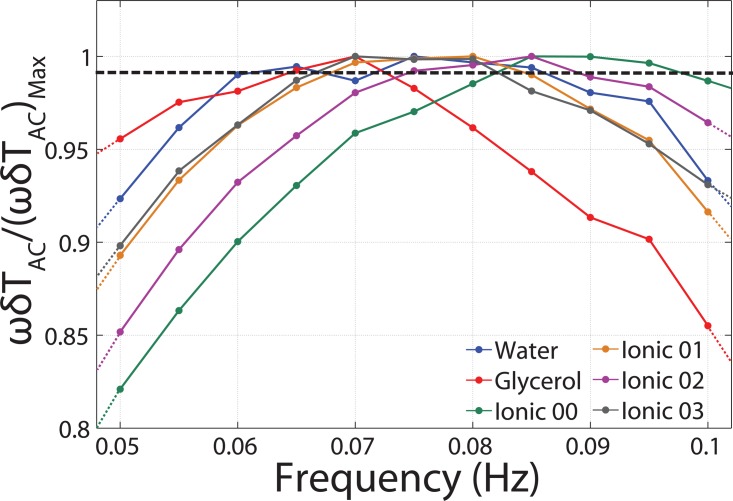
The specific heat of a sample is determined from the frequency at which the normalized value, , is maximum to satisfy the required condition (Eq. 6), where Tac is the amplitude of temperature oscillation.1 Figure 10 shows the normalized Tac graph for different measured samples. A 1% error line is used to detect the thermal bandwidth of the system and determine the working frequency of the TWA method for each sample.
Figure 10.
The normalized values of the measured Tac for different samples are illustrated. The dotted line represents the 1% error line and the selected frequency within this range that satisfies the TWA condition.
The specific heat, cp can be expressed with measured AC temperature at the sensor
| (7) |
where the C0 is the input power calibration factor, Pin is the input power, ω is the frequency of input thermal wave, m is the mass of the sample, and is the amplitude of oscillating temperature. The input power calibration factor is used to reduce the measurement error by calibration of effective input power to the chamber excluding the heat loss. DI-water sample is used to calculate the calibration factor for input power.
The specific heat of DI-water is measured (3.93 J/g K) by the described method and the measured value is in good agreement(∼5% error) with reported value.49 The heat capacity for different Ionic liquids is measured for the first time. For the Ionic liquids, 1-ethyl-3-methylimidazolium bis(trifluoromethylsulfonyl)imide ([EMIM][Tf2N]), 1-buthyl-3-methylimidazolium hexafluorophosphate ([BMIM][PF6]), 1-hexyl-3-methylimidazolium hexafluorophosphate ([HMIM][PF6]), and 1-methyl-3-octylimidazolium hexafluorophosphate ([OMIM][PF6]), the measured specific heats are 2.75, 2.83, 0.86, 2.55 J/g K, respectively. The specific heat measurement results, using the TWA method is presented to demonstrate the feasibility of performing specific heat measurement with the fabricated μ-calorimeter for different liquid samples. The measured errors in the thermal parameters are always less than 10%, and it might be caused by two reasons: The high surface area of the chamber, which cases heat loss to the environment and the small volume (200 nl) of samples where in all of measured parameters the bulk samples with large volume is being used.
CONCLUSION
We demonstrate a novel on-chip μ-calorimeter fabricated using wafer-scale 3D micromachining processes to measure the thermal properties of liquid samples. Our fabrication method of μ-calorimeter allows the integration of heaters and temperature sensors on the 3-dimensional chambers for the efficient coupling and detection of heat from the thermal elements for accurate characterization. The reaction chambers of the μ-calorimeter are fully enclosed using thin film materials to reduce the thermal mass of the system and are suspended by narrow tethers to increase the thermal resistance without any bonding process. The incorporation of the heater and the sensor on opposite sides of the reaction chamber allows for the measurement of both the thermal diffusivity and specific heat without changing or re-configuring the measurement setup. Two methods, the time delay and thermal wave analysis, are used to determine the thermal diffusivity and capacitance showing repeatable measured performance and good agreement (within 8%) with previously reported results. The μ-calorimeter can characterize liquid samples using only a small volume of sample (200 nl) and can be used to perform various measurements with the same sample and the same setup.
ACKNOWLEDGMENTS
Partial financial support for this work was provided by the U.S. National Science Foundation through the Industry/University Cooperative Research Center on Water Equipment & Policy located at the University of Wisconsin-Milwaukee (IIP-0968887) and Marquette University (IIP-0968844).
References
- Garden J.-L., Chteau E., and Chaussy J., Appl. Phys. Lett. 84, 3597 (2004). 10.1063/1.1737794 [DOI] [Google Scholar]
- Jelesarov I. and Bosshard H. R., J. Mol. Recognit. 12, 3 (1999). [DOI] [PubMed] [Google Scholar]
- Khler J. and Henkel T., Appl. Microbiol. Biotechnol. 69, 113 (2005). 10.1007/s00253-005-0176-6 [DOI] [PubMed] [Google Scholar]
- Zhang Y. and Tadigadapa S., Appl. Phys. Lett. 86, 034101 (2005). 10.1063/1.1850186 [DOI] [Google Scholar]
- Xu J., Reiserer R., Tellinghuisen J., Wikswo J. P., and Baudenbacher F. J., Anal. Chem. 80, 2728 (2008). 10.1021/ac702213d [DOI] [PMC free article] [PubMed] [Google Scholar]
- Wonhee Lee J. L. and Koh J., Nanobiosens. Dis. Diagn. 2012(1), 17. 10.2147/NDD.S26438 [DOI] [Google Scholar]
- Lee W., Fon W., Axelrod B. W., and Roukes M. L., Proc. Natl. Acad. Sci. U. S. A. 106, 15225 (2009). 10.1073/pnas.0901447106 [DOI] [PMC free article] [PubMed] [Google Scholar]
- Ariga K., Hill J. P., Lee M. V., Vinu A., Charvet R., and Acharya S., Sci. Technol. Adv. Mater. 9, 014109 (2008). 10.1088/1468-6996/9/1/014109 [DOI] [PMC free article] [PubMed] [Google Scholar]
- Zhuravlev E. and Schick C., Thermochim. Acta 505, 1 (2010). 10.1016/j.tca.2010.03.019 [DOI] [Google Scholar]
- Iervolino E., van Herwaarden A., and Sarro P., Thermochim. Acta 492, 95 (2009). 10.1016/j.tca.2009.04.021 [DOI] [Google Scholar]
- Lerchner J., Wolf A., Wolf G., Baier V., Kessler E., Nietzsch M., and Krgel M., Thermochim. Acta 445, 144 (2006). 10.1016/j.tca.2005.07.011 [DOI] [Google Scholar]
- Zhang Y. and Tadigadapa S., Biosens. Bioelectron. 19, 1733 (2004). 10.1016/j.bios.2004.01.009 [DOI] [PubMed] [Google Scholar]
- Hashimoto T., Morikawa J., Kurihara T., and Tsuji T., Thermochim. Acta 304–305, 151 (1997). 10.1016/S0040-6031(97)00026-9 [DOI] [Google Scholar]
- Morikawa J., Leong C., Hashimoto T., Ogawa T., Urata Y., Wada S., Higuchi M., and Takahashi J.-I., J. Appl. Phys. 103, 063522 (2008). 10.1063/1.2899181 [DOI] [Google Scholar]
- Cahill D. G., Rev. Sci. Instrum. 61, 802 (1990). 10.1063/1.1141498 [DOI] [Google Scholar]
- Huth H., Minakov A. A., and Schick C., J. Polym. Sci., Part B: Polym. Phys. 44, 2996 (2006). 10.1002/polb.20921 [DOI] [Google Scholar]
- Arpaci V. S., Conduction Heat Transfer (Addison-Wesley Pub. Co., 1966). [Google Scholar]
- Winter W. and Hhne G. W., Thermochim. Acta 403, 43 (2003). 10.1016/S0040-6031(03)00159-X [DOI] [Google Scholar]
- Maltezos G., Gomez A., Zhong J., Gomez F. A., and Scherer A., Appl. Phys. Lett. 93, 243901 (2008). 10.1063/1.3046789 [DOI] [Google Scholar]
- Velve Casquillas G., Fu C., Le Berre M., Cramer J., Meance S., Plecis A., Baigl D., Greffet J.-J., Chen Y., Piel M., and Tran P. T., Lab Chip 11, 484 (2011). 10.1039/c0lc00222d [DOI] [PubMed] [Google Scholar]
- Hsieh T.-M., Luo C.-H., Huang F.-C., Wang J.-H., Chien L.-J., and Lee G.-B., Sens. Actuators, B 130, 848 (2008). 10.1016/j.snb.2007.10.063 [DOI] [Google Scholar]
- Wang J.-H., Chien L.-J., Hsieh T.-M., Luo C.-H., Chou W.-P., Chen P.-H., Chen P.-J., Lee D.-S., and Lee G.-B., Sens. Actuators, B 141, 329 (2009). 10.1016/j.snb.2009.06.034 [DOI] [Google Scholar]
- Selva B., Marchalot J., and Jullien M.-C., J. Micromech. Microeng. 19, 065002 (2009). 10.1088/0960-1317/19/6/065002 [DOI] [Google Scholar]
- de Mello A. J., Habgood M., Lancaster N. L., Welton T., and Wootton R. C. R., Lab Chip 4, 417 (2004). 10.1039/b405760k [DOI] [PubMed] [Google Scholar]
- Wu J., Cao W., Wen W., Chang D. C., and Sheng P., Biomicrofluidics 3, 012005 (2009). 10.1063/1.3058587 [DOI] [PMC free article] [PubMed] [Google Scholar]
- Shah J. J., Geist J., and Gaitan M., J. Micromech. Microeng. 20, 105025 (2010). 10.1088/0960-1317/20/10/105025 [DOI] [Google Scholar]
- Kempitiya A., Borca-Tasciuc D. A., Mohamed H. S., and Hella M. M., Appl. Phys. Lett. 94, 064106 (2009). 10.1063/1.3078273 [DOI] [Google Scholar]
- Shaw K. J., Docker P. T., Yelland J. V., Dyer C. E., Greenman J., Greenway G. M., and Haswell S. J., Lab Chip 10, 1725 (2010). 10.1039/c000357n [DOI] [PubMed] [Google Scholar]
- Guijt R. M., Dodge A., van Dedem G. W. K., de Rooij N. F., and Verpoorte E., Lab Chip 3, 1 (2003). 10.1039/b210629a [DOI] [PubMed] [Google Scholar]
- Miralles V., Huerre A., Malloggi F., and Jullien M.-C., Diagnostics 3, 33 (2013). 10.3390/diagnostics3010033 [DOI] [PMC free article] [PubMed] [Google Scholar]
- Lee C.-Y. and Lee G.-B., J. Micromech. Microeng. 13, 620 (2003). 10.1088/0960-1317/13/5/313 [DOI] [Google Scholar]
- Tong A., Sens. Rev. 21, 193 (2001). 10.1108/02602280110398044 [DOI] [Google Scholar]
- Childs P. R. N., Greenwood J. R., and Long C. A., Rev. Sci. Instrum. 71, 2959 (2000). 10.1063/1.1305516 [DOI] [Google Scholar]
- Dziedzic A., Golonka L. J., Kozlowski J., Licznerski B. W., and Nitsch K., Meas. Sci. Technol. 8, 78 (1997). 10.1088/0957-0233/8/1/011 [DOI] [Google Scholar]
- Santos E. J. P. and Vasconcelos I., in Proceedings of the 26th International Conference on Microelectronics (2008), pp. 333–336.
- Dusen M. S. V., J. Am. Chem. Soc. 47, 326 (1925). 10.1021/ja01679a007 [DOI] [Google Scholar]
- Lacy F., IEEE Sens. J. 11, 1208 (2011). 10.1109/JSEN.2010.2089977 [DOI] [Google Scholar]
- Jin J. S., Lee J. S., and Kwon O., Appl. Phys. Lett. 92, 171910 (2008). 10.1063/1.2917454 [DOI] [Google Scholar]
- Zhang Q., Zhang X., Cao B., Fujii M., Takahashi K., and Ikuta T., Appl. Phys. Lett. 89, 114102 (2006). 10.1063/1.2338885 [DOI] [Google Scholar]
- Kish L. B., Phys. Lett. A 305, 144 (2002). 10.1016/S0375-9601(02)01365-8 [DOI] [Google Scholar]
- White D. R., Galleano R., Actis A., Brixy H., Groot M. D., Dubbeldam J., Reesink A. L., Edler F., Sakurai H., Shepard R. L., and Gallop J. C., Metrologia 33, 325 (1996). 10.1088/0026-1394/33/4/6 [DOI] [Google Scholar]
- Adrega T. and van Herwaarden A., Sens. Actuators, A 167, 354 (2011). 10.1016/j.sna.2011.03.027 [DOI] [Google Scholar]
- Parker W. J., Jenkins R. J., Butler C. P., and Abbott G. L., J. Appl. Phys. 32, 1679 (1961). 10.1063/1.1728417 [DOI] [Google Scholar]
- Mendelsohn A. R., Appl. Phys. Lett. 2, 19 (1963). 10.1063/1.1753717 [DOI] [Google Scholar]
- Chen L. and Clarke D. R., Comput. Mater. Sci. 45, 342 (2009). 10.1016/j.commatsci.2008.10.011 [DOI] [Google Scholar]
- Taylor R. E. and Cape J. A., Appl. Phys. Lett. 5, 212 (1964). 10.1063/1.1723593 [DOI] [Google Scholar]
- Matvienko A. and Mandelis A., Int. J. Thermophys. 26, 837 (2005). 10.1007/s10765-005-5581-7 [DOI] [Google Scholar]
- Balderas-Lopez J. A., Mandelis A., and Garcia J. A., Rev. Sci. Instrum. 117, 2933 (2000). 10.1063/1.1150713 [DOI] [Google Scholar]
- Meng G., Jaworski A. J., and White N. M., Chem. Eng. Process. 45, 383 (2006). 10.1016/j.cep.2005.10.004 [DOI] [Google Scholar]


