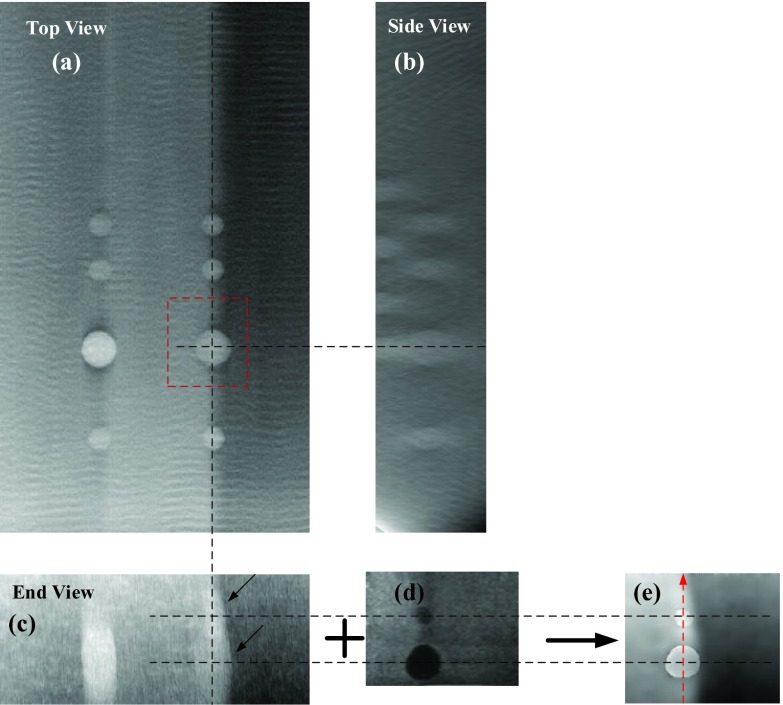
Figure 8.
Comparison between the DBT and AUS-corrected DBT images in Z direction. (a)–(c) are all slice images showing different views of the 8 mm cyst reconstructed using the conventional SART. (d) shows the corresponding perfectly registered AUS slice. (e) shows the corresponding AUS-corrected DBT image. Voxel size in the image plane and slice interval of all the images are 0.1 mm. The DBT and AUS images are all shown in the same scale to make a better comparison. Distance from the center slice (a) to the bottom of the phantom is 13.3 mm.

