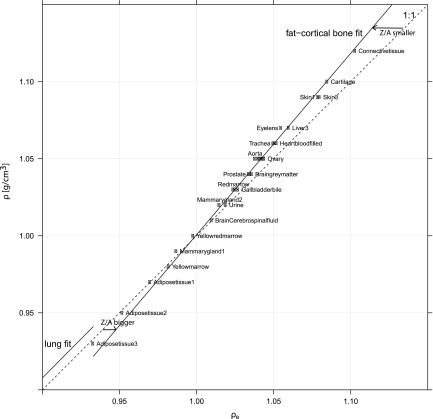
Figure 5.
Mass density to relative electron density fits in the soft tissue region. Shown are the lung and adipose-bone fits (applied in this paper in Sec. 2B), and the identity (1:1). Three different regions appear, mainly determined by different Z/A ratios: lung (Z/A similar to muscle), adipose region (Z/A bigger than water due to increased hydrogen amount), and one region with decreasing Z/A ratio toward cortical bone. An additional fit for the adipose region might improve mass density prediction for hydrogen rich tissues (Secs. 4B, 3E).

