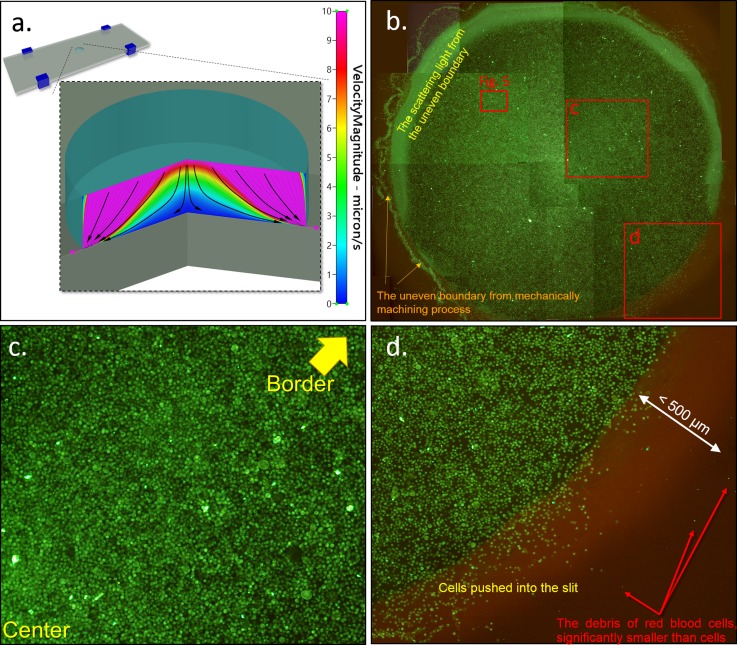
Figure 4.
(a) Numerical simulation results by CFD-RC illustrating the flow field in the self-assembly cell chip when the velocity of slip flow is 10 μm/s. The results show that the lateral velocity is higher when it is closer to the top or edge of the well. (b) Photograph of the cell arrangement in the well (diameter of 5 mm). The distribution of cells is similar to the results of numerical simulation. About 250 000 cells, 12 photos combined. (c) The region near center. (d) The border region.

