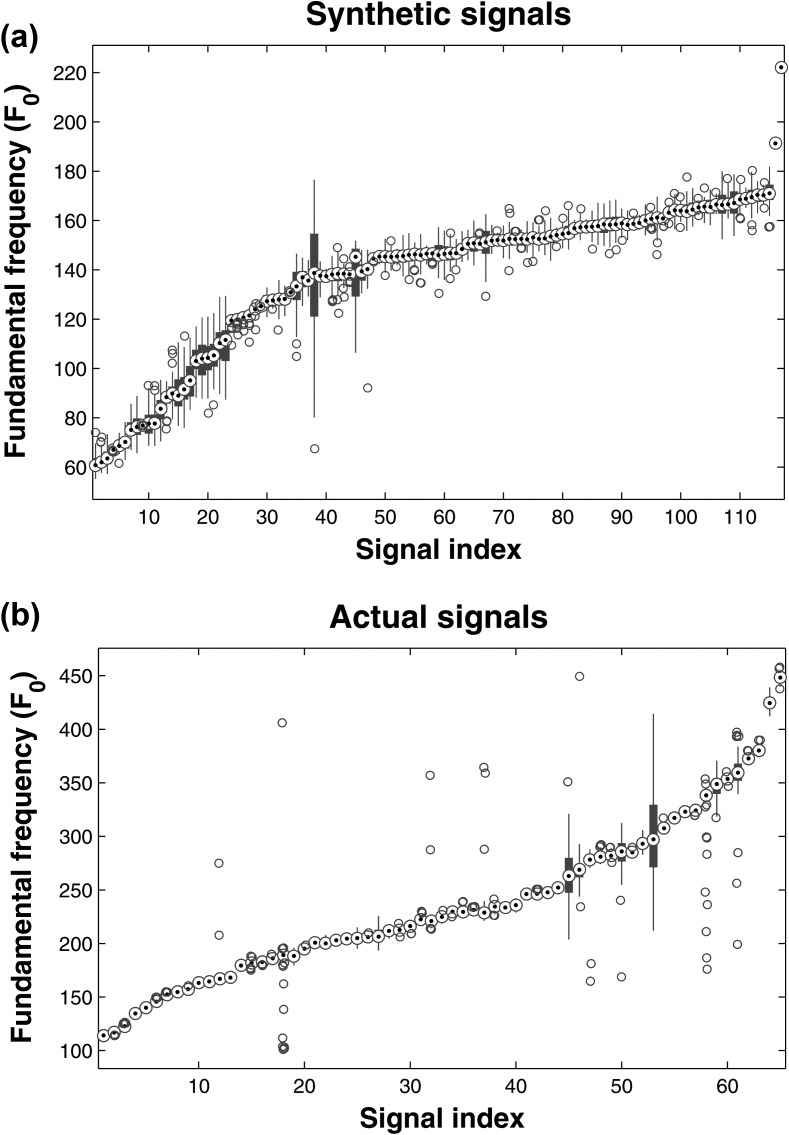
Figure 1.
(Color online) Summary of ground truth values for (a) 117 speech signals generated using a physiological model of speech production (synthetic signals) and (b) 65 actual speech signals where simultaneous EGG recordings were available. The middle point represents the median and the bars represent the interquartile range. For convenience in presentation, the signals are sorted in ascending order of . Outliers (if any) are marked individually with circles.

