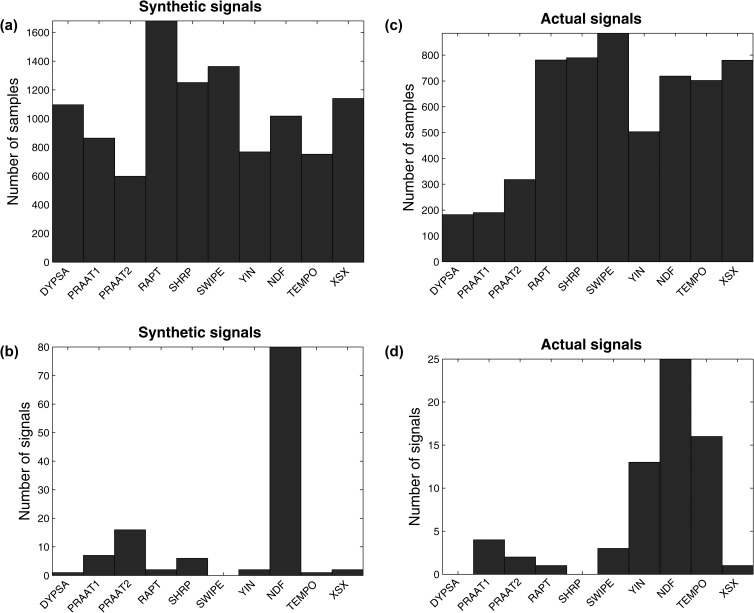
Figure 3.
(Color online) Histogram depicting the number of times each of the estimation algorithms was the most successful algorithm in estimating for each of the assessments in (a) the database with the synthetic speech signals for each of the 10 530 samples, (b) the database with the synthetic speech signals for each of the 65 signals, (c) the database with the actual speech signals for each of the 5850 samples, and (d) the database with the actual speech signals for each of the 117 signals.

