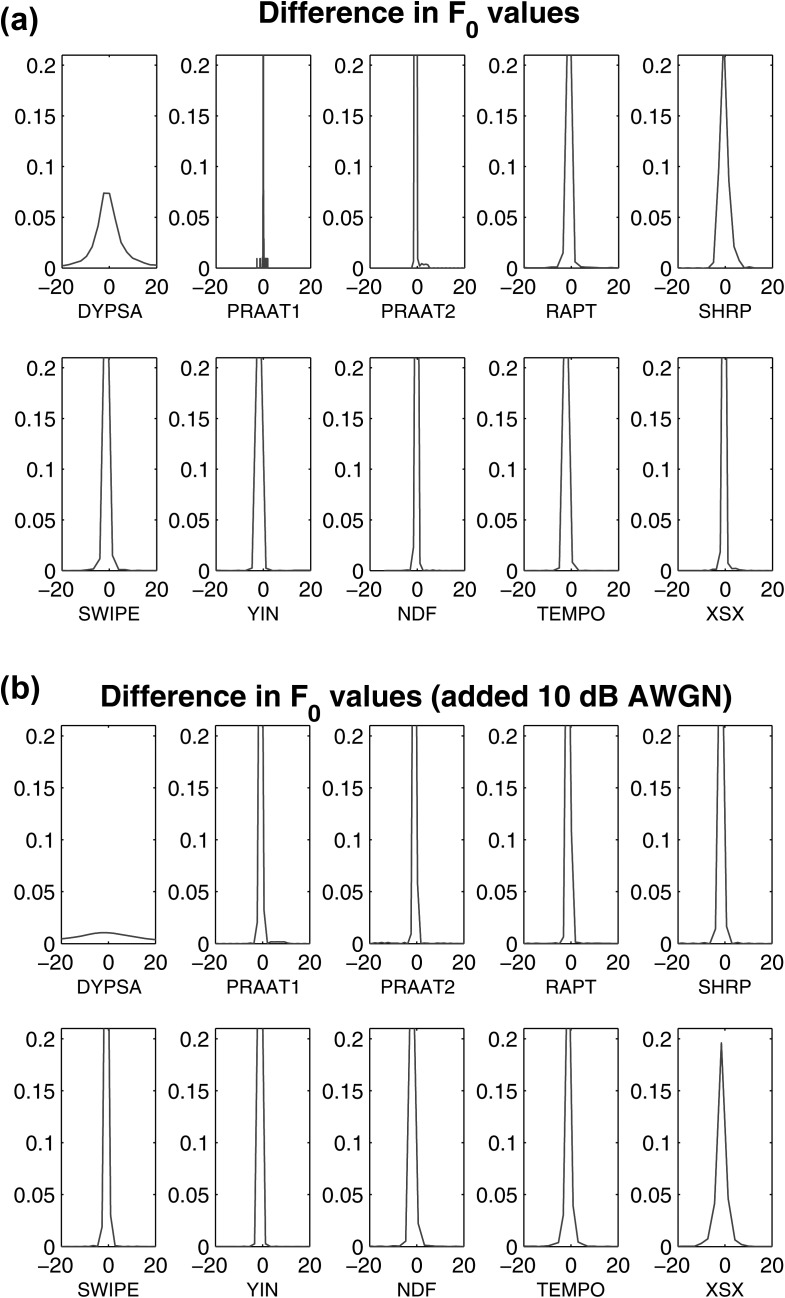
Figure 5.
(Color online) Density estimates for the difference when (a) the values were estimated using a sampling frequency of 44.1 kHz versus 8 kHz and (b) the values were estimated for the actual speech signals at 44.1 kHz versus the case when 10 dB AWGN was introduced to the signals prior to computing the . In both cases we used the database with the actual speech recordings.

