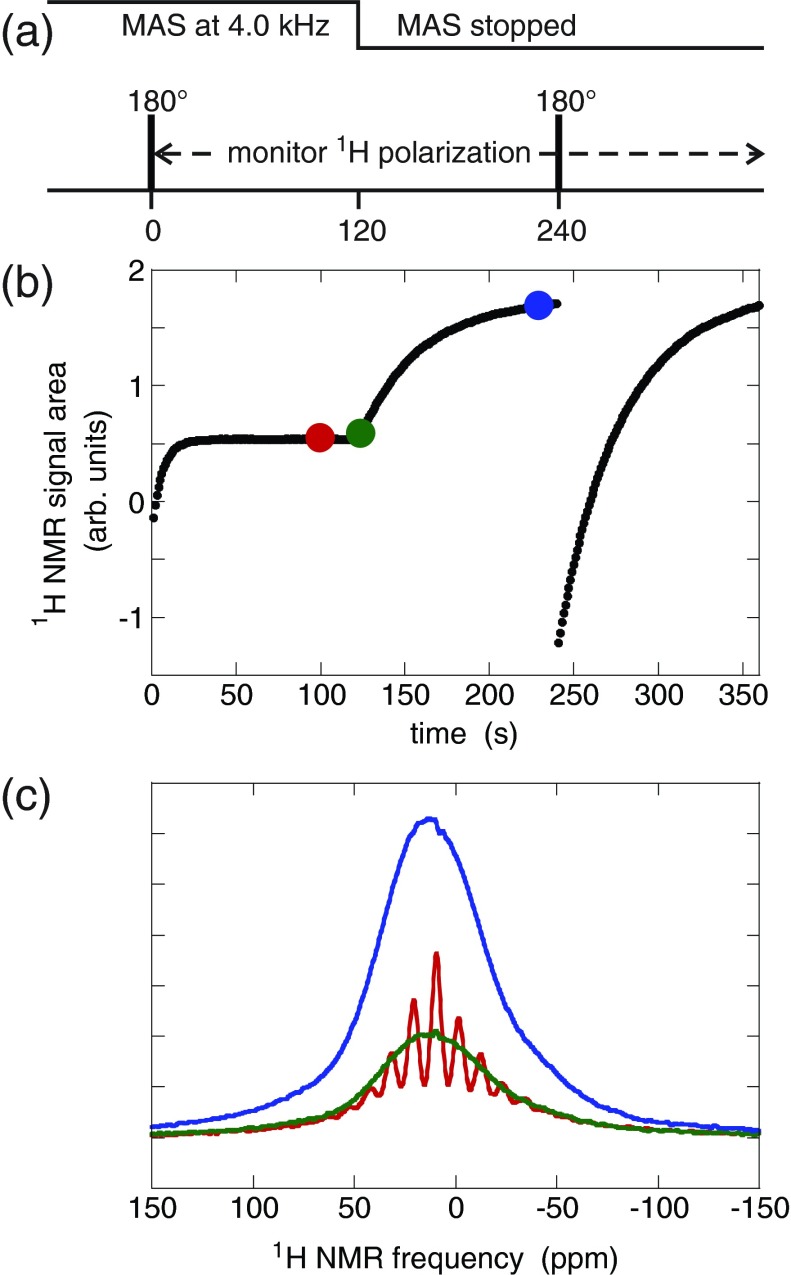
Figure 3.
Direct measurement of the effect of MAS on steady-state 1H spin polarization in sample 6 (DOTOPA-Ethanol doped) at 27 K. (a) Timing sequence. After MAS at 4.0 kHz for more than 100 s, the 1H polarization is inverted with a single 180° pulse at 0 s. The 1H polarization is then monitored continuously by recording free-induction decay signals after 5° pulses, once per second. MAS is stopped at 120 s, changing from 4.0 kHz to 0 kHz within 4 s. A second 180° pulse is applied at 240 s. (b) Areas of 1H spectra during the polarization monitoring period. (c) 1H spectra at 100 s (red), 124 s (green), and 230 s (blue). The steady-state 1H spin polarization without MAS is about four times larger than the steady-state 1H spin polarization with MAS. The apparent 1H T1 value without MAS is about 6 times larger than the apparent 1H T1 value with MAS.

