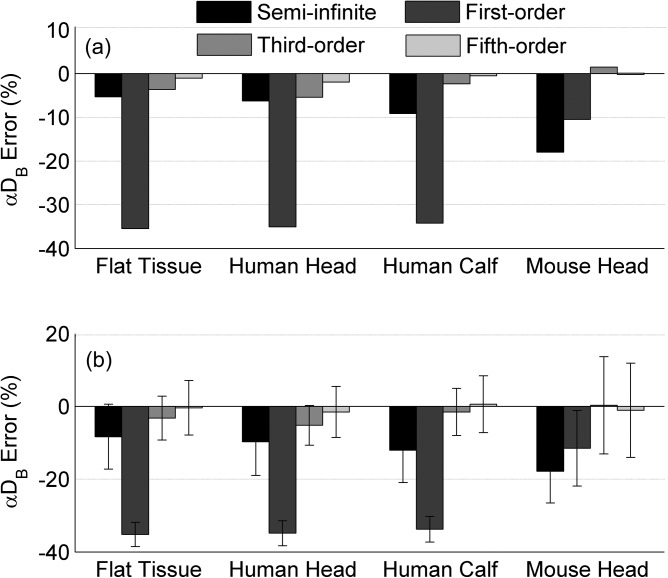
Figure 2.
Percentage errors of αDB at the first step of BFI (i.e., αDB (1) = 1 × 10⁻⁸ cm2/s) in four tissue models reconstructed from the simulated DCS data (a) without and (b) with noises. The average errors calculated from the simulated 1000 autocorrelation curves with noises (b) are presented as means ± standard deviations (error bars).

