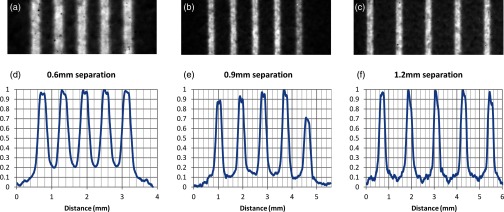
Figure 7.

Films and dose profiles of microbeams delivered with different center to center (c-t-c) spacings. Vertical axes in graphs (d)–(f) represent relative dose (normalized to the maximum dose). Film (a) and profile (d) of 290 μm microbeams delivered at 600 μm c-t-c spacing. Film (b) and profile (e) of similar beams delivered at 900 μm spacing. Note that there was an error in delivery in the fifth beam so only the previous four were used in the PVDR and valley width calculations. Film (c) and profile (f) of beams delivered at 1200 μm spacing. Also note the higher noise level in the valley at the largest c-t-c spacing, indicating the possibility of a lack of measurable dose in this region.
